

US natural gas futures hovered near $3.05 per MMBtu on November 11 as the December front-month contract consolidated gains following the November expiry at $2.776.
The market finds itself at a crossroads: domestic production has surged to record levels above 109 Bcf/d, ordinarily a bearish signal, yet liquefied natural gas feedgas volumes have simultaneously hit all-time highs.
Rubinax dissects the tug-of-war between record supply and record exports that has kept natural gas pinned in a narrow range.
With European benchmark prices trading near EUR 101 per megawatt-hour, roughly eleven times the Henry Hub equivalent, the arbitrage incentive to maximise LNG loadings remains overwhelming.
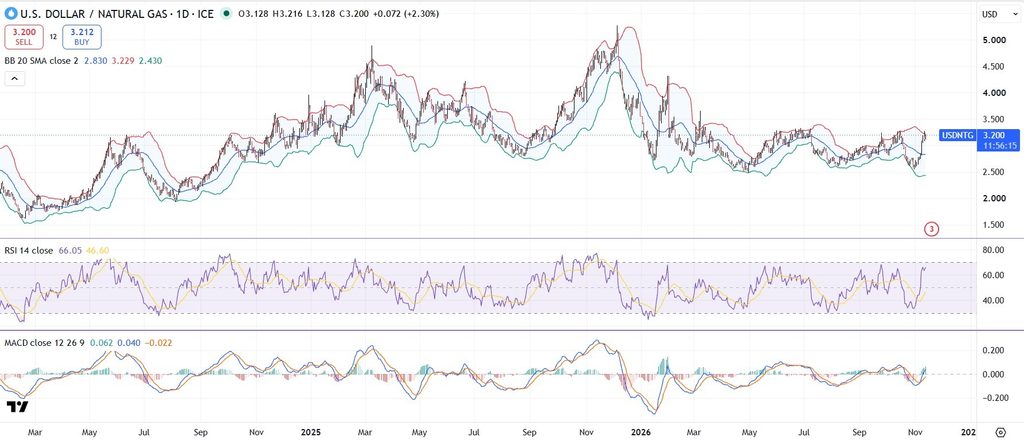
Price Action Trapped Between Trendline Support and Overhead Supply
The December contract has established a trading range between $2.90 and $3.25 since rolling into the front-month position.
Momentum indicators reflect this indecision. The 14-day RSI oscillates near 51, effectively neutral, offering no directional bias to momentum-following systems.
The MACD histogram hovers around the zero line with minimal amplitude, confirming a market in equilibrium.
Bollinger Bands have narrowed significantly on the daily chart, a compression pattern that often precedes a sharp directional move once the catalyst arrives; in previous instances this year, such squeezes have resolved within five to eight sessions.
Should the market break above $3.25 on a closing basis, the next resistance zone sits at $3.50 to $3.80, the area that capped the early-October rally. A break below $2.90 would target the $2.70 region where the 200-day moving average provides structural support.
Notably, January futures, which carry the winter demand premium, already trade above $3.40, reflecting the market’s expectation that cold weather will eventually tighten balances even if November remains mild.
Record Production Meets Record LNG Feedgas in a Shifting Market
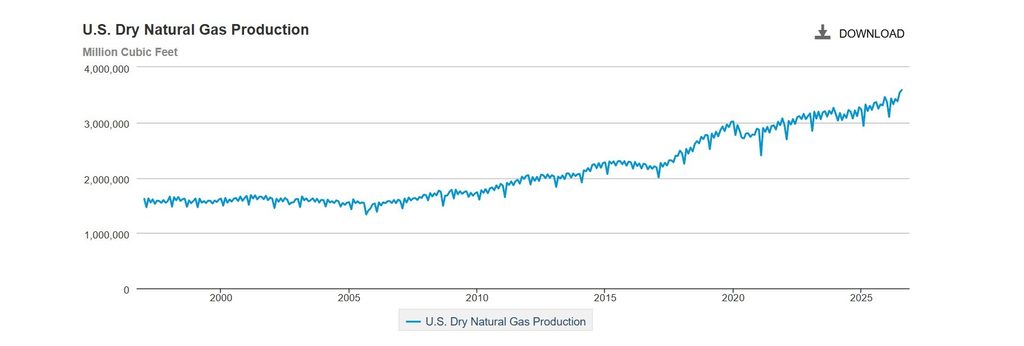
US dry gas production has averaged above 109 Bcf/d through November, with some daily readings touching 112 Bcf/d.
This output represents a year-on-year increase of approximately 4% and reflects both the ramp-up of associated gas from Permian Basin oil drilling and the commissioning of new Haynesville Shale wells specifically targeting LNG export terminals along the Gulf Coast.
Producers have maintained high activity levels despite moderating prices, as hedging programmes locked in during the first quarter continue to insulate revenues.
On the demand side, LNG feedgas deliveries have reached a record 21.2 Bcf/d, absorbing roughly 19% of total domestic production. The Plaquemines LNG facility in Louisiana has been ramping steadily through its commissioning phase, and Sabine Pass continues to operate at near-maximum throughput.
European storage levels, while adequate for the current mild November weather, remain below the five-year average heading into the peak heating season, sustaining the transatlantic price premium that incentivises maximum US export volumes for months to come.
Domestic storage inventories sit at approximately 3,800 Bcf, roughly 4% above the five-year seasonal average. While this surplus provides a cushion against early-winter supply disruptions, it has been gradually eroding as LNG exports divert molecules that would otherwise flow into underground storage facilities.
The pace of weekly injections has slowed notably compared to the same period last year, narrowing the year-on-year surplus from 9% in August to its current 4%, a trend that would accelerate sharply if sustained cold weather arrives in December.
Weather Models and the Winter Premium Ahead
Near-term weather forecasts lean bearish for gas bulls. The National Weather Service’s 6-to-10-day outlook calls for above-normal temperatures across the eastern two-thirds of the continental United States, delaying the onset of meaningful heating demand that typically begins in mid-November.
Extended-range models through late November suggest a gradual cooling trend but no polar vortex disruptions comparable to the late-January episode that briefly pushed spot prices above $7.00 and sent the Algonquin Citygate basis to record premiums.
Traders should monitor the Bollinger Band squeeze closely. A compression of this magnitude on the daily chart has resolved with $0.40 to $0.60 moves in previous instances this year, and the direction will likely be determined by whether the mid-November weather models shift colder or confirm the current warm bias.
Power generation demand, which accounts for approximately 35% of domestic gas consumption, will also be sensitive to temperature departures from normal, as utilities switch between gas and coal depending on relative fuel economics and dispatch order.
The forward curve structure adds context to the near-term outlook. The December-to-January calendar spread has widened to approximately $0.35, pricing in seasonal tightening that has yet to materialise in physical flows.
Natural gas is coiled in a tight range as record production and record LNG exports offset each other. The $2.90 to $3.25 corridor will resolve soon, and the catalyst will almost certainly be weather; until a sustained cold pattern materialises, the upside remains capped by the persistent output surplus.