

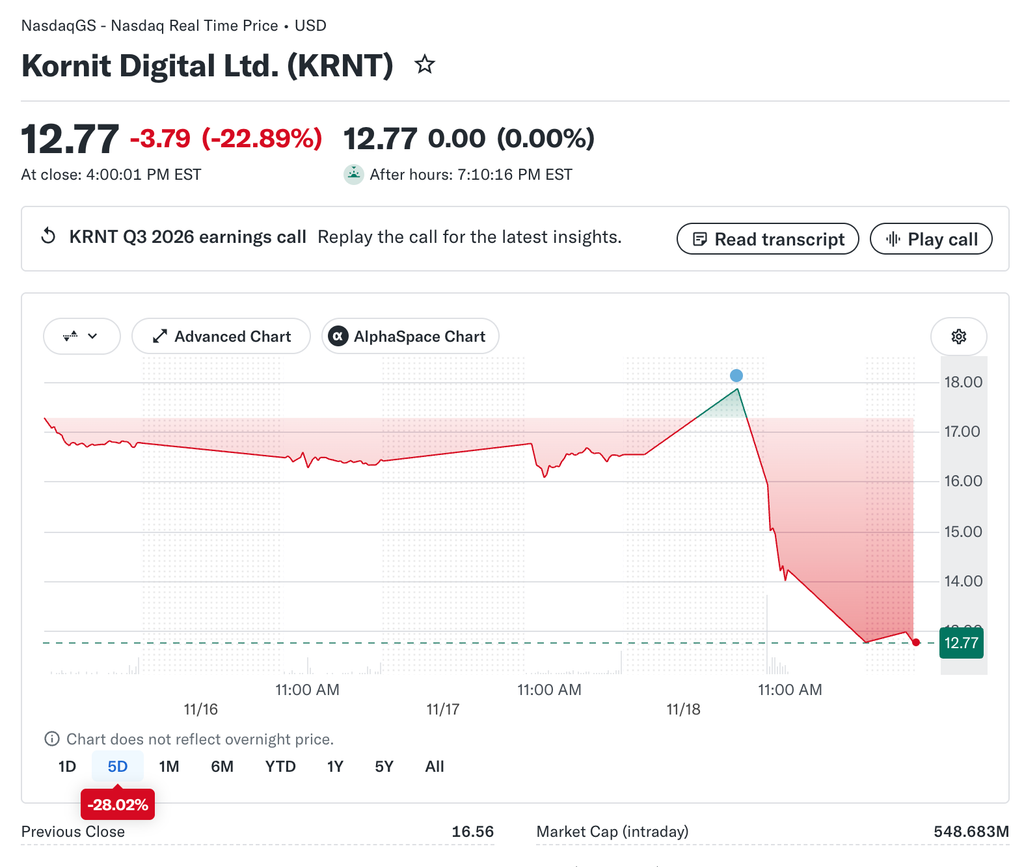
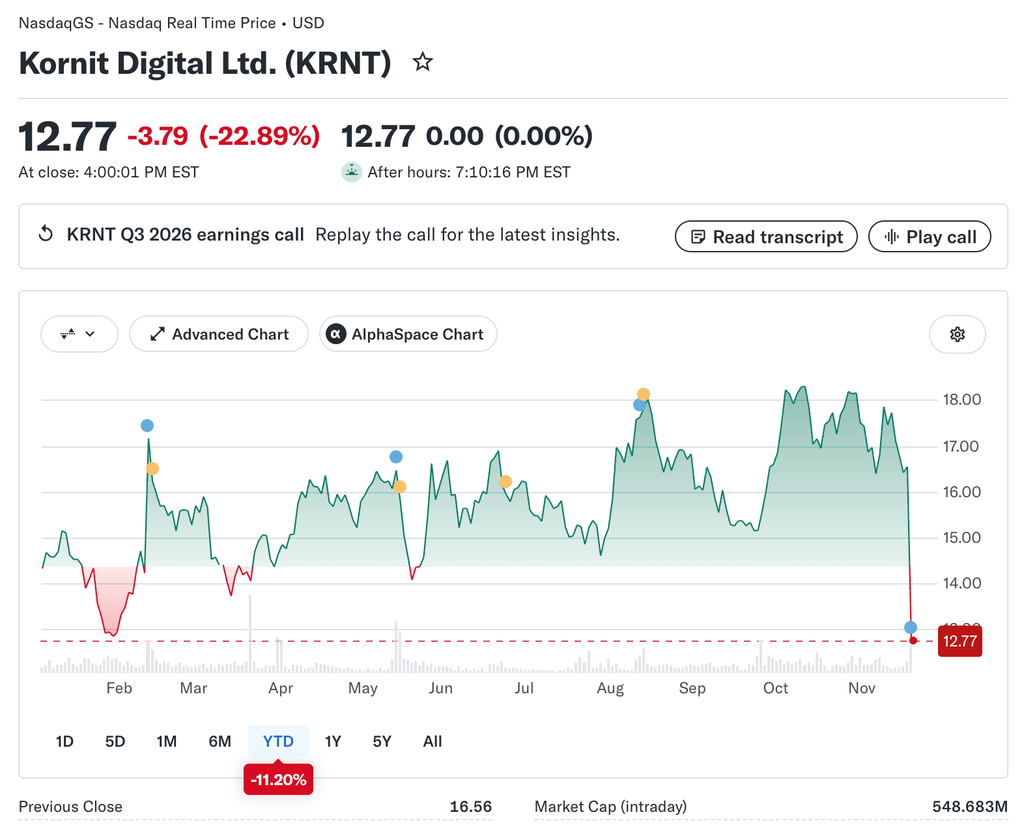
Kornit Digital posted quarterly revenue of $58.3 million, near the top of its own guide. Shares gained about 8% in early trading. A finance expert at Chilli Markets said the recurring revenue story is improving faster than the cash story.
The digital textile printing maker nearly broke even on a reported basis. A loss of one cent a share compares with a larger loss a year earlier. Adjusted earnings reached $0.11 a share.
Services Gain Ground
Product sales reached $40.0 million, up about 5%. Services reached $18.3 million, up 22%. Total revenue grew roughly 10%.
Services now supply about 31% of sales, up from roughly 28%. That shift counts because service income repeats. It also tends to carry steadier demand than machine sales.
The Recurring Revenue Gauge
Annual recurring revenue reached $39.4 million, up 83% from $21.5 million. That equals about 17% of annualized quarterly sales. A year ago the share was near 10%.
Revenue from the company’s AIC model grew 70%. Total contract value also rose 70%, to $162.4 million. That is about four times recurring revenue, which hints at a long pipeline.
Margins Hold Steady
Gross margin stayed at 43.5% on a reported basis, and 45.8% adjusted. Neither moved from the prior year. The improvement therefore came from spending, not pricing.
Reported operating expenses grew only about 3.5% while revenue grew near 10%. The reported operating loss narrowed to $6.8 million from $8.1 million. Adjusted EBITDA margin rose to 4.6% from 2.0%.
Reported gross profit of about $25 million covers only 79% of reported operating expenses. The business still needs more scale to cover its fixed costs. Revenue growth near 10% a year narrows the gap slowly.
Nine Months in Perspective
Revenue for nine months reached $162.2 million, up about 8.6% from $149.3 million. Adjusted EBITDA turned positive at only $0.2 million, versus a loss of $4.0 million. That is a swing of about $4.2 million.
Adjusted net income edged up to $6.6 million, or $0.14 a share. The reported loss widened about 30% to $19.8 million. The company’s adjusted view looks healthier than the reported one.
The Gap Between Two Profit Views
Adjusted net income was $5.3 million, while the reported figure was a loss of $0.4 million. About $5.7 million of adjustments separate them. Management strips out items it views as outside normal operations.
Legal fees from a class action make up part of the gap. Those fees reached $7.3 million over nine months. That equals about 37% of the nine-month reported loss of $19.8 million.
Buybacks Outrun Cash Generation
Cash and investments fell to about $428 million from $491 million at the start of the year. That is a drop of roughly $63 million. Buybacks of $52.5 million explain about 83% of it.
Operating cash flow was only $13.9 million for nine months. Capital spending took $17.4 million. Free cash flow was slightly negative, near $3.5 million.
Where the Cash Sits
Short-term deposits hold about $312 million, or roughly 73% of the total. Plain cash is only about $29 million. Marketable securities cover the remaining $87 million, with $52 million held long term.
That mix is liquid enough for buybacks. It is also exposed to interest rate swings. Lower deposit rates would trim interest income.
Quarter-Level Cash Math
The third quarter alone shows the strain. Buybacks reached $15.0 million, while operating cash flow was only $0.5 million. Repurchases ran about 30 times operating cash flow.
The company still has a large reserve. Even so, shareholders’ equity fell about 8% to $653.5 million. A steady drain would eventually limit flexibility.
Cash Per Share
Adjusted net income of $5.3 million at $0.11 a share implies about 48 million diluted shares. Cash and investments of $428 million then equal roughly $8.90 a share. That is a rough estimate from rounded inputs.
Buybacks shrink the share count and lift per-share results. They also spend the same cash that backs the balance sheet. Investors should weigh both effects.
Guidance for the Final Quarter
Revenue is guided to a range of $60 million to $65 million. The midpoint of $62.5 million is about 7% above the latest quarter. Adjusted EBITDA margin is guided to 6.5% to 9.0%.
At midpoints, adjusted EBITDA would be near $4.8 million. Adding the nine-month revenue gives a full-year total near $225 million. The company did not provide guidance on reported figures.
What Portfolio Holders Should Track
Three items deserve attention. They are recurring revenue, free cash flow, and the pace of buybacks. Recurring revenue growth that slows would raise concern.
Position sizing should reflect a stock that rose on one report. Staged entries reduce timing risk. Diversified holders can pair industrial technology exposure with steadier sectors.