

The analysts at Vestronyx take a close look at BNB, the token that powers one of the most active blockchains in the crypto industry. The coin lost about 3.1% over the last day and trades near $680, yet the activity on its network tells a very different story from the price chart.
BNB Slips While Its Network Stays Busy
Binance Coin has moved lower in the last twenty-four hours, and holders who only watch the price may feel discouraged.
So far, the market has not rewarded the coin for this activity, and that gap between usage and price is the main theme for this week. Under the surface, however, the picture looks healthier. On November 9, BNB Chain recorded about 4.86 million active addresses in a single day, more than any other blockchain tracked by on-chain analytics.
For comparison, Solana came second with roughly 1.97 million addresses, and Ethereum showed around 535,000. That makes BNB Chain about two and a half times busier than its closest rival and close to nine times busier than the largest smart contract network.
Why Network Activity Matters For The Coin
Every transaction on BNB Chain requires a fee paid in the native token. When more wallets send transactions, more users need the coin, and daily traffic turns into a steady source of demand. This link is one of the main arguments used by supporters of the asset.
Some caution is useful here. Active address counts can include automated wallets and low-value transfers, so a high number does not always mean that new money is entering the market.
The coin also has a market value of about $89 billion, which is large enough that even a record day on the network usually moves the price by only a few percent. Activity can support the price over time, but it rarely produces a quick jump.
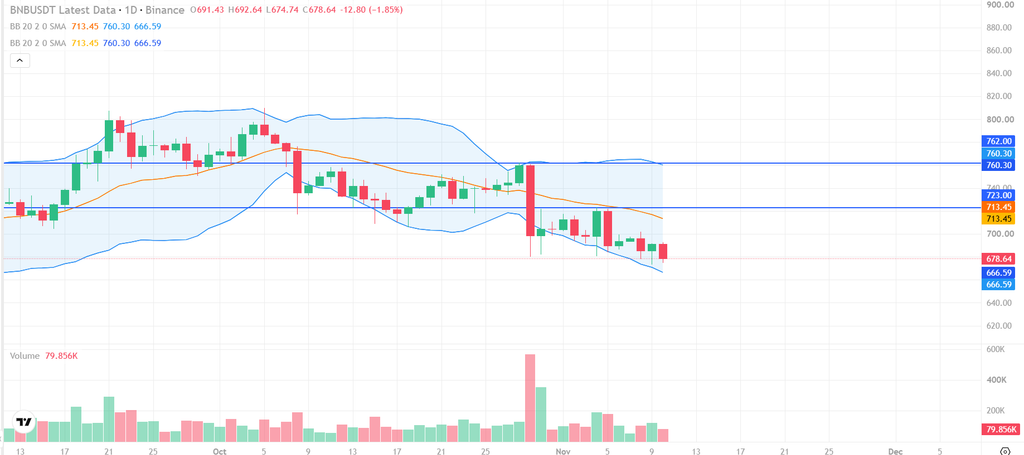
Technical Picture: Buyers Face A Ceiling
On the daily chart, BNB reached a peak near $723 earlier this week and then retreated. That high is now the most important target for buyers, and it sits roughly 6% above the current price.
The Bollinger Bands, a tool that draws a channel around the average price to show how far the market normally swings, give useful guidance.
The upper band is near $762, about 12% higher, and the lower band is near $667. The price is now in the lower half of that channel, which suggests that sellers have a small advantage for the moment, even though the swing has not yet turned into a larger decline.
Inflation Data Could Decide The Next Step
Today brings the US inflation report, and the numbers will affect every risk asset, including digital currencies. A reading hotter than forecast would strengthen the case for higher interest rates, which usually hurts coins that depend on investor appetite for risk. A softer reading could lift the whole market and give BNB the push it needs to challenge the recent peak.
Because of this event, volatility may rise in the next few hours, and false moves are common in the first minutes after the release.
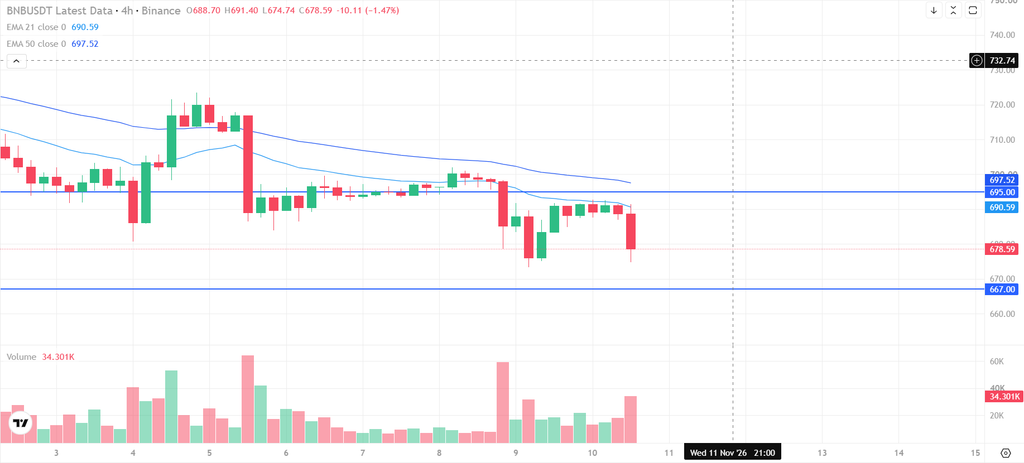
Support And Resistance Levels
On the upside, the first resistance is at $695, only about 2% above the current price. A daily close over it would show that buyers are returning, and the next target would be the weekly high at $723. Beyond that, the upper Bollinger Band near $762 would be a stretch goal that requires strong demand.
On the downside, the first support is near $667, where the lower band is located. A daily close below this level would open the way to a deeper correction, because there is no obvious floor close by to slow sellers.
What Traders Can Do
A cautious plan is to wait for the market’s first response to the inflation numbers. If BNB closes a day above $695, buyers could target $723, with a stop-loss placed under the breakout area. If the price closes below $667, sellers may have the upper hand, and a bounce back toward $695 could offer a chance to look for short positions.
Position size should stay modest, since the daily range can widen quickly when macroeconomic news arrives. Traders may also compare activity on the network with the price over several weeks, because a longer rise in usage can add context to a technical signal.
Conclusion
BNB is trading below $695 while its blockchain leads the industry in daily users. The $695 resistance and the $667 support are the levels that matter, and a close beyond either one will probably decide the next direction. If buyers clear the first barrier, the weekly peak at $723 is within reach, a gain of around 6%.
Traders following Crypto strategies should watch the inflation data, network activity and the reaction at these levels, since these factors are likely to guide the next move in Binance Coin.