

Charles de Beaumont, senior market analyst at Fontevrel Group, points out that Bitcoin is facing one of its toughest periods of the year. BTC trades near $63,200, and the market is now asking whether the price can hold above the key $60,000 area or whether a deeper move is still needed before buyers return.
Bitcoin Pauses After A Steep Fall
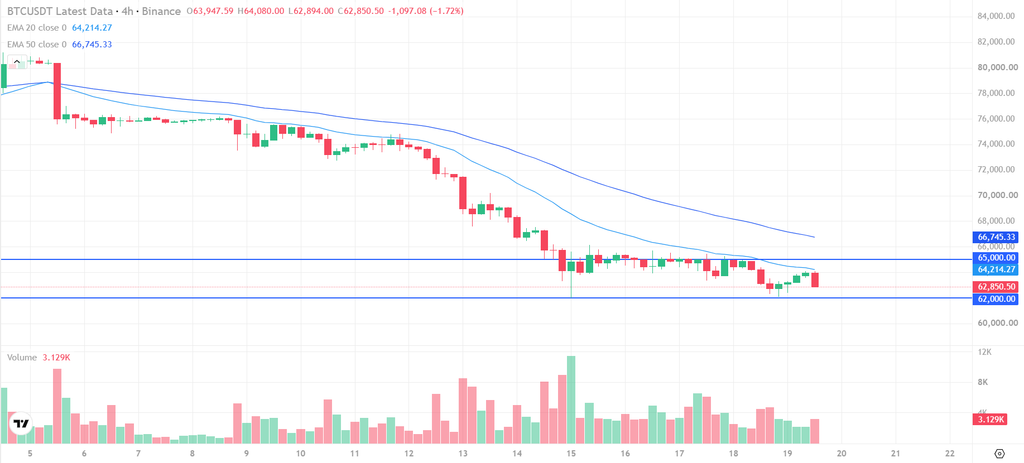
Within a short stretch, Bitcoin has dropped from the area of $80,000 to nearly $60,000, ending the rally that had lifted the market earlier. At the moment, the price is consolidating a little above $63,000, but the move looks more like a rest than a recovery.
The decline has little to do with chart patterns. It reflects a weaker US economic outlook, and investors have preferred to reduce risk. When the economy and monetary policy dominate the story, technical signals often lose power, and crypto assets follow the broader mood of the market.
Extreme Fear And Rate Hike Bets
Sentiment is very weak. The widely followed crypto sentiment gauge has fallen to 12, inside the extreme fear zone and its weakest level since February, when Bitcoin traded only slightly above the current price.
Interest rates are part of the problem. Futures data shows that traders now expect two consecutive increases from the Federal Reserve, one in December and one in January. Higher rates make risky assets less attractive, and Bitcoin has historically struggled when liquidity becomes more expensive.
According to Paul Laffont, the next moves in BTC will depend more on macro news than on price signals. Oil prices, geopolitical developments and US inflation remain the main catalysts. Positive news on any of these fronts could improve the mood quickly, while negative news could deepen the sell-off.
An industry analyst recently summed up the situation by saying that unless Fed expectations shift, fund inflows pick up or big buyers come back, a sideways market is the most likely outcome.
ETF Outflows Reach Multi-Year Highs
The weakness is also visible in exchange-traded funds that hold Bitcoin. These products lost $538 million in net flows this week alone, a sign that traditional investors continue to stay away from digital assets.
Since the start of November, withdrawals have reached about $2.9 billion in only 19 days. If this pace continues, the month could end with outflows close to $5 billion, which would be the largest monthly figure for over two years. Persistent selling by large institutions removes an important source of demand and keeps rallies short.
Could A Deeper Drop Come First?
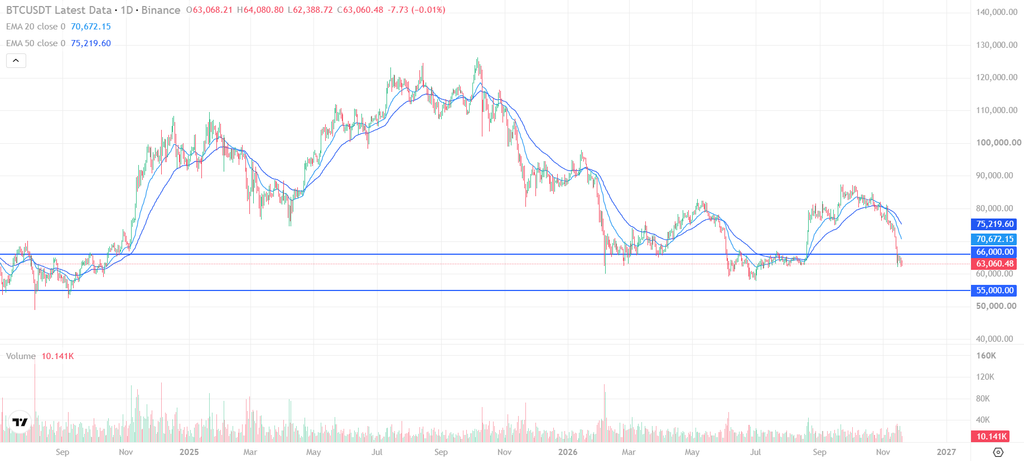
The daily chart offers a useful comparison. A similar situation occurred this year: after a strong decline that began in May, Bitcoin bounced from the region of $60,000 in the summer, but that first rebound did not last. The real rally started only after the price dipped below that low, forcing late sellers to close their positions and giving buyers the fuel they needed.
If the same pattern repeats, Bitcoin could first fall to $57,000 and then rebound toward the $62,000 area. A stronger version of the scenario would send the price to $55,000, below the July low, before a lasting recovery can start.
This is only one possible path, but it shows why a break under $60,000 would not necessarily end the bull market. It could also be the final shakeout.
Support And Resistance Levels
On the downside, the first support is $62,000, just under the current price. Below it, $60,000 is the key psychological floor and the previous low, followed by $57,000 and $55,000, which is the target of the deeper scenario.
On the upside, the first resistance is $65,000, a round number above the current range. A daily close above it would suggest that the pressure is easing, and the next barrier would be $70,000, with the $80,000 peak far above.
What Traders Can Do
In a market dominated by fear, patience matters. Paul Laffont suggests that traders avoid chasing short bounces and wait for confirmation near the main supports.
Buyers may look for signs of exhaustion near $57,000 or $55,000, such as a quick recovery after a dip under $60,000, and then aim for $62,000. A daily close above $65,000 would be a stronger signal, with a stop-loss under the latest low.
Sellers may wait for a rebound toward $65,000 that fails, or a four-hour close under $60,000, with $57,000 and $55,000 as targets. Position size should stay moderate, since crypto can move several percent within hours, and a stop-loss should always be set before entering.
Conclusion
Bitcoin is under pressure from rate expectations, extreme fear and heavy ETF outflows, while a deeper drop remains possible before a real recovery. The $60,000 support and the $65,000 resistance are the levels to follow.
Traders following Crypto strategies should watch Fed expectations, fund flows and the reaction at these levels, since these factors are likely to guide the next move in BTC, as Paul Laffont’s analysis suggests.