

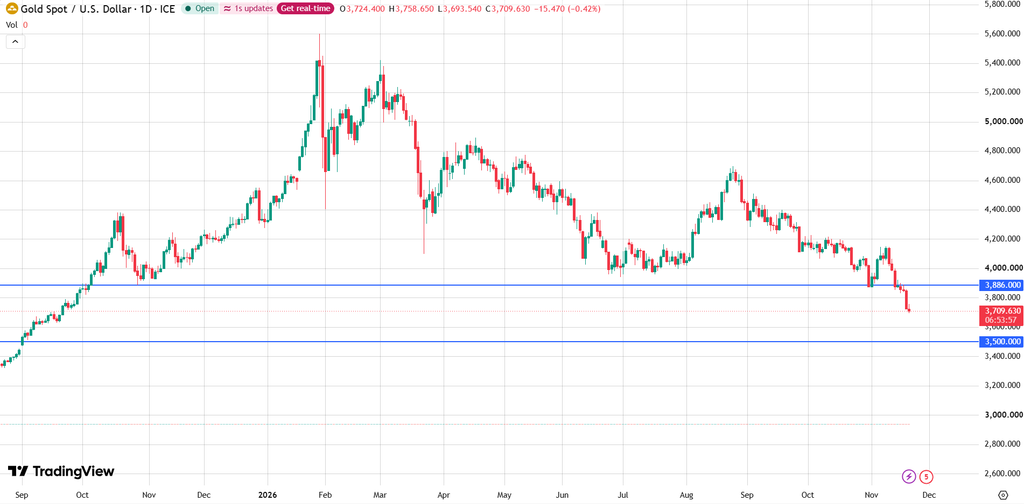
Strategic advisory insights provided by Victoria Rousseau, senior market analyst at Fontevrel Group, indicate that gold has entered a more dangerous phase after losing an important technical floor. XAU/USD trades near $3,700 per ounce, down almost 4% on the day, and the chart now points toward a much deeper support area.
Gold Slides Further
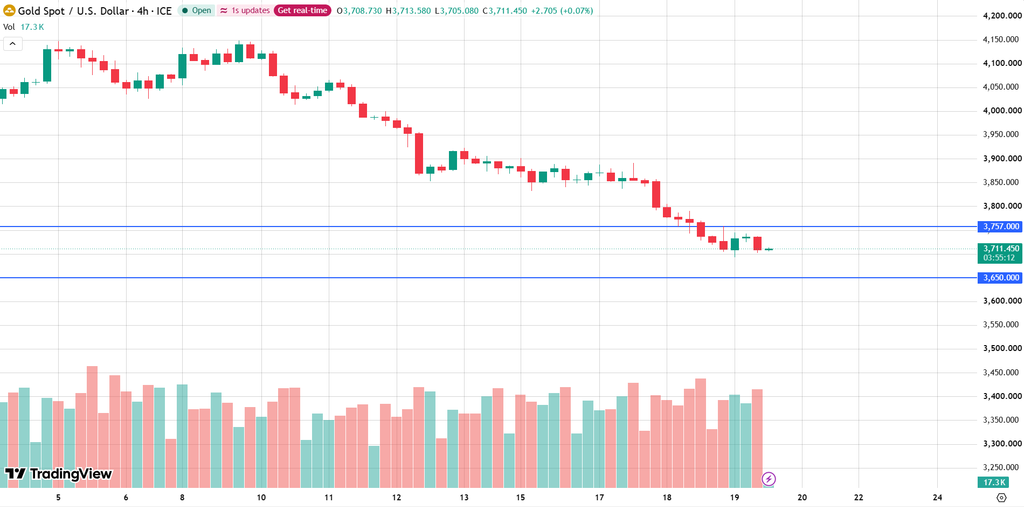
On Wednesday, sellers stayed in control from the first hours of trading. The metal printed a new low at $3,720, and it kept trading close to the bottom of the session instead of bouncing back. By Thursday, the price had slipped even further, to roughly $3,704.
Before that, buyers had one chance to react. A small support zone between $3,736 and $3,757 was tested at the start of the move, and the price rebounded for a short time. The recovery did not last, and sellers pushed gold under the zone. When a support area fails right after its first test, it usually shows that the bears are stronger than the bulls.
Why The Break Below October’s Low Matters
The more important event is the move under the October swing low at $3,886. That level was the last higher low of the previous rising trend, so losing it damages the whole structure of the advance.
Earlier warning signs had appeared before, but each time the market failed to follow through lower, and the uptrend survived. This time the drop is decisive. According to Paul Laffont, such a clean break raises the odds that lower targets will be reached before the metal finds a durable low.
The metal is also moving inside a falling channel. If the decline continues, the lower edge of that channel becomes a natural destination, and the latest move makes that scenario more likely.
The Major Support Zone Near $3,500
The next big area of interest lies between $3,500 and $3,475. It is a confluence zone, which means that several technical factors meet there, and it could be extended lower if selling gets stronger.
The upper edge of the zone coincides with the April high, the ceiling of a base that took nineteen weeks to build. Prices often find buyers near the top of such a base, and the price could even drop deeper into the formation before a recovery starts. The lower boundary of the channel is also sloping toward this area, which adds another reason to expect a test.
From the current price, the path to this zone is almost a straight line down, with no major obstacle in between except the small levels discussed below.
Fibonacci Levels May Offer Only A Short Pause
Two interim supports remain before the $3,500 area. The first is the 61.8% Fibonacci retracement, located at $3,705, and the second is the 78.6% one, at $3,650. Gold is already trading right at the first one, so a short rebound would not be a surprise.
However, these retracements line up with just a minor sideways phase from September, so they are not as strong as the larger base near $3,500. A bounce from these levels may become a simple counter-trend move, not the start of a new rally. In this context, the decisive break under $3,886 points the market toward lower supports, and every bounce should be treated with caution.
Support And Resistance Levels
On the downside, the first support is the Fibonacci level at $3,705, then $3,650 comes next. Below them, the key confluence zone spans $3,500 down to $3,475, and a break through it would open space for even lower prices.
On the upside, the first resistance is the zone between $3,736 and $3,757, where support failed on Wednesday and which may now act as a ceiling. Above it, the main barrier is the $3,886 swing low, and only a recovery above that level would weaken the bearish picture.
What Traders Can Do
After such a sharp drop, patience is important. Paul Laffont suggests that traders avoid chasing the move and wait for a clear reaction at the nearby supports, since a sudden bounce can happen at any moment.
Sellers may wait for a rebound toward $3,736 to $3,757 that fails, or for a four-hour close below $3,650. The first target would be $3,500, with a stop-loss above $3,757.
Buyers may prefer to stay aside until gold stabilizes. A daily close above $3,757 would be a first sign of recovery, and a move above $3,886 would be a much stronger one. Position size should stay moderate, and a stop-loss should always be placed before entering.
Conclusion
Gold has broken a major technical level and now faces a possible slide toward the $3,500 support zone. The $3,705 and $3,650 supports and the $3,757 resistance are the levels to follow.
Traders following Commodities strategies should watch these levels closely, since they are likely to guide the next move in gold, as Paul Laffont’s analysis suggests.