

Ethereum slipped to approximately $2,200 during the November 11 session, extending a painful multi-week decline that has pushed the second-largest cryptocurrency by market capitalization below its 200-day exponential moving average and into firmly bearish technical territory on the daily timeframe.
The sell-off has accelerated since early October, driven by persistent outflows from spot Ethereum exchange-traded funds, a heavily skewed options market tilted toward puts, and broader risk aversion across digital asset classes that has spared only Bitcoin from the worst of the drawdown.
Analysts from Rubinax analyse the converging headwinds facing Ethereum as it approaches critical support zones.
Despite the token’s foundational role in decentralised finance, smart-contract execution, and the tokenisation of real-world assets, near-term price action remains firmly in the hands of institutional flow dynamics and macro sentiment, both of which currently favour the bears and show few signs of reversal.
Technical Indicators Signal Continued Downside Pressure
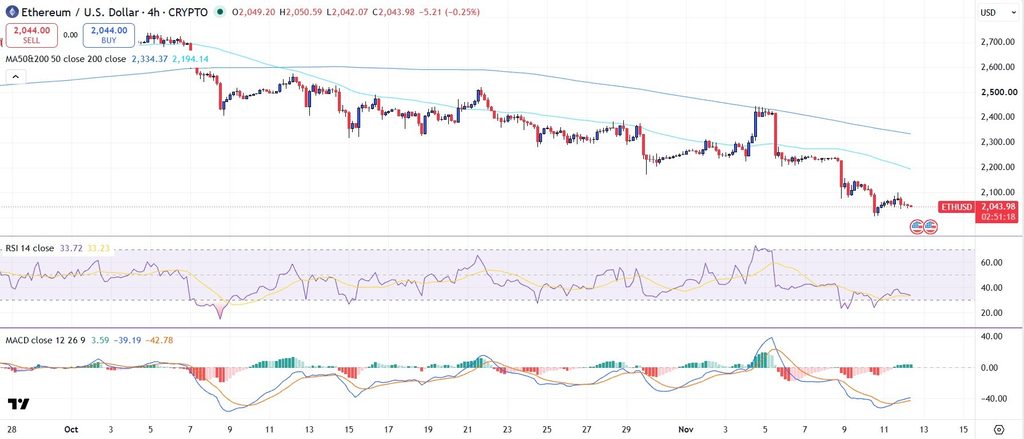
Ethereum is trading below both its 200-day EMA near $2,194 and its 50-day EMA at $2,334, a configuration that confirms a bearish daily bias.
The Supertrend indicator, calculated on default parameters, has flipped bearish and currently sits at $2,008, marking the next meaningful technical support should the Bollinger Band give way.
Momentum readings paint a similarly cautious picture. The 14-day RSI hovers near 35, approaching oversold territory without yet reaching the sub-30 levels that typically precede sharp reversals in large-cap cryptocurrencies.
The MACD line remains below the signal line on the daily chart, with the histogram printing consecutive negative bars over the past eight sessions.
Until the RSI dips below 30 or the MACD delivers a bullish crossover, short-term rallies are more likely to encounter selling than sustain upward momentum, and counter-trend longs carry elevated risk.
ETF Outflows and Options Data Reinforce Bearish Positioning
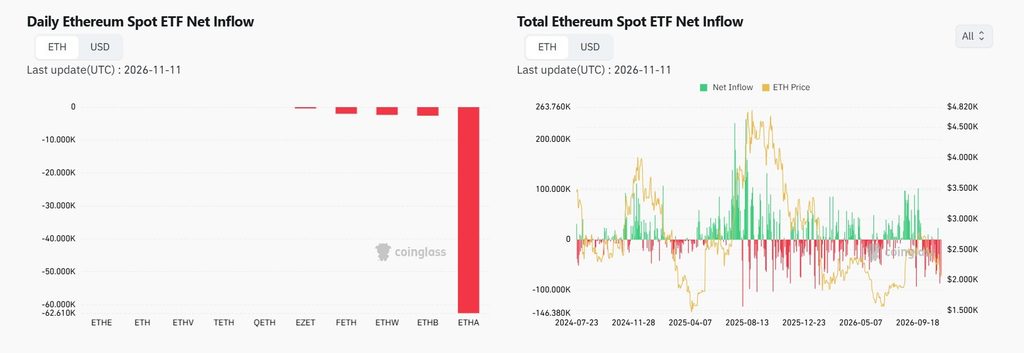
Spot Ethereum ETFs recorded net outflows of $365.2 million during the week of November 2 to 6, bringing the cumulative October drawdown to approximately $1.61 billion.
This marks six consecutive weeks of net negative flows, a streak that underscores institutional reluctance to accumulate Ethereum at current valuations.
The contrast with Bitcoin ETFs, which have attracted sporadic inflows during the same period, suggests a rotation out of altcoins rather than a blanket retreat from the digital asset class.
Options market data adds another bearish dimension. Open interest for the November 13 expiry shows 77,441 put contracts against just 24,464 call contracts, producing a put-to-call ratio of approximately 3.16 to 1.
Such a pronounced skew indicates that derivatives traders are actively hedging or speculating on further downside, with the maximum pain price clustered near $2,300, well above the current spot rate, meaning that expiry mechanics are unlikely to provide meaningful support.
On-chain concentration data reveals that a single entity, the mining conglomerate BitMine, now holds roughly 6.07 million ETH, equivalent to 4.97% of total circulating supply.
This position approaches the 5% threshold that has historically drawn regulatory scrutiny for traditional asset classes, and any forced selling or voluntary distribution from this holder could amplify downward pressure on an already fragile order book.
Key Levels and Catalysts for the Week Ahead
Resistance sits in a layered zone between $2,300 and $2,360, where the 200-day EMA and a cluster of unfilled sell orders converge. A reclaim of this area on strong volume would be the first constructive signal in weeks, potentially attracting short covering that could propel prices toward the $2,415 50-day EMA.
A sustained push above $2,575 would be required to negate the broader downtrend and shift the medium-term bias back to neutral.
On the support side, a daily close below $2,200 would likely accelerate selling toward the $2,008 Supertrend level.
The options expiry will be a near-term volatility event; with the current spot price sitting below maximum pain, market makers may have limited incentive to defend lower strikes, potentially allowing momentum to carry prices further south without the gravitational pull.
Macro developments will also matter significantly for risk assets in the coming sessions. Wednesday’s US CPI release could influence risk appetite across all speculative markets, including cryptocurrencies and altcoins in particular.
A hotter-than-expected inflation print would dampen expectations for further Federal Reserve easing, compounding the existing pressure on yield-sensitive assets like Ethereum and reinforcing the ongoing rotation toward Bitcoin as the digital asset sector’s perceived safe harbour.
Ethereum faces a challenging confluence of technical deterioration, institutional outflows, and bearish derivatives positioning.
Until ETF flows stabilize and the 200-day EMA is reclaimed on convincing volume, rallies should be treated as selling opportunities rather than evidence of a trend reversal, and risk management remains paramount for any exposure to the token.