

Silver prices steadied near $49.20 per ounce during the November 11 session, consolidating above the psychologically significant $49.00 threshold after a volatile week shaped by shifting risk appetite and renewed dollar weakness.
The precious metal has staged a quiet recovery from its late-October pullback to multi-week lows, buoyed by growing expectations that the Federal Reserve will continue easing monetary policy into 2027.
Analysts from Rubinax examine the technical and fundamental landscape surrounding silver as it tests a critical inflection zone.
With industrial demand from solar panel manufacturing and electronics production still accelerating, and mine output unable to close a widening deficit, the metal finds itself supported by forces that extend well beyond its traditional safe-haven appeal and into the core of the global green energy transition.
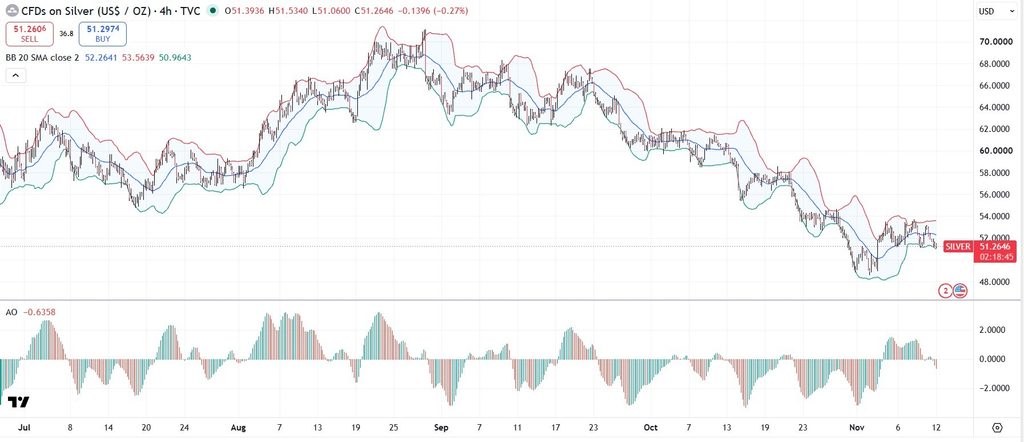
Technical Structure Points to a Battle at Key Resistance
On the daily chart, silver is trading within a descending channel that has defined price action since the metal peaked above $71.00 in September. The immediate floor sits at $49.00, a level that has attracted consistent buying interest over the past two weeks.
Below that, $48.62 marks the most recent swing low, and a decisive break beneath it would expose the $47.50 area where the 100-day simple moving average converges with horizontal support from the August consolidation range.
On the upside, sellers have congregated near $50.00, a round-number barrier reinforced by the 50-day exponential moving average. A sustained push above that level would open the door to $52.50 and subsequently the $55.00 Bollinger Band midline that has capped rallies since October.
Structural Supply Deficit Underpins the Medium-Term Outlook
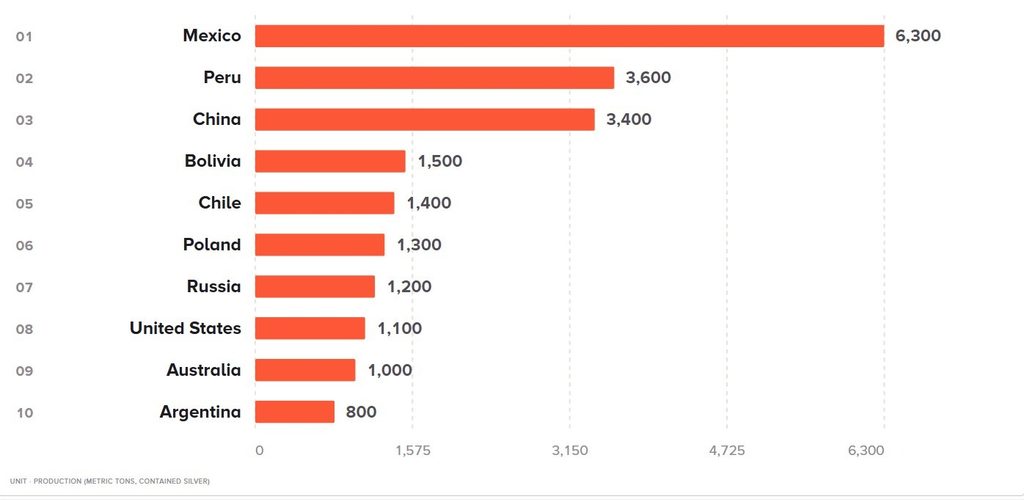
Silver is on course for a fifth consecutive annual supply deficit, according to the Silver Institute. Global mine production has plateaued near 830 million ounces annually, while total demand, spanning industrial fabrication, jewellery, silverware, and investment, continues to push above 1.2 billion ounces.
The resulting shortfall has gradually eroded above-ground inventories, leaving the market increasingly sensitive to any demand shock that could tighten physical availability further.
Industrial consumption accounts for more than 55% of total silver demand, a share that has grown steadily as the global energy transition accelerates. Photovoltaic cell production alone consumed an estimated 230 million ounces in 2025, and forecasts point to continued double-digit growth in solar installations through the end of the decade.
Electronics, automotive wiring, and medical device manufacturing provide additional pillars of industrial demand that are structurally insensitive to price fluctuations at current levels.
Meanwhile, the US dollar has softened after the Senate advanced a government reopening package, easing fiscal uncertainty that had previously supported the greenback.
A weaker dollar mechanically lifts dollar-denominated commodity prices, and silver has been a direct beneficiary. Federal funds futures now price roughly 75 basis points of additional easing by mid-2027, a trajectory that would further compress real yields and enhance the appeal of non-yielding assets like silver.
Gold’s resilience above $2,600 also provides a supportive backdrop, as silver tends to outperform its yellow counterpart during the later stages of precious-metal rallies.
Macro Calendar and Catalysts to Monitor This Week
This week brings several data releases with the potential to move silver sharply. US Consumer Price Index figures for October, due on Wednesday, will provide the latest reading on inflationary pressures; a softer print would reinforce rate-cut expectations and likely push silver higher.
Producer Price Index data follows on Thursday, offering a complementary view of upstream cost dynamics that feed into the broader disinflation narrative.
Beyond the immediate calendar, traders should watch the $50.00 level closely. A weekly close above it would break the descending channel pattern and likely trigger momentum-driven buying from systematic funds and commodity trading advisers.
Conversely, a failure to hold $49.00 on a closing basis would validate the bearish channel and risk a deeper correction toward $47.50 before dip buyers re-emerge in size.
Positioning data from the Commodity Futures Trading Commission shows that managed-money net longs have contracted over the past three reporting periods, suggesting that speculative froth has been cleared.
Any bullish catalyst from this cleaner positioning base could produce a sharper move than recent price action would imply, particularly given the structural supply deficit that limits the downside when physical demand remains robust and exchange-registered inventories sit at multi-year lows.
Silver sits at a technical crossroads, caught between a bearish channel and fundamentally supportive supply-demand dynamics.
The $49.00 to $50.00 range is the battleground; the direction of the breakout will likely define the trajectory for the remainder of the quarter, and the weight of evidence from both the deficit data and the rate-expectations curve tilts cautiously toward the bulls.