

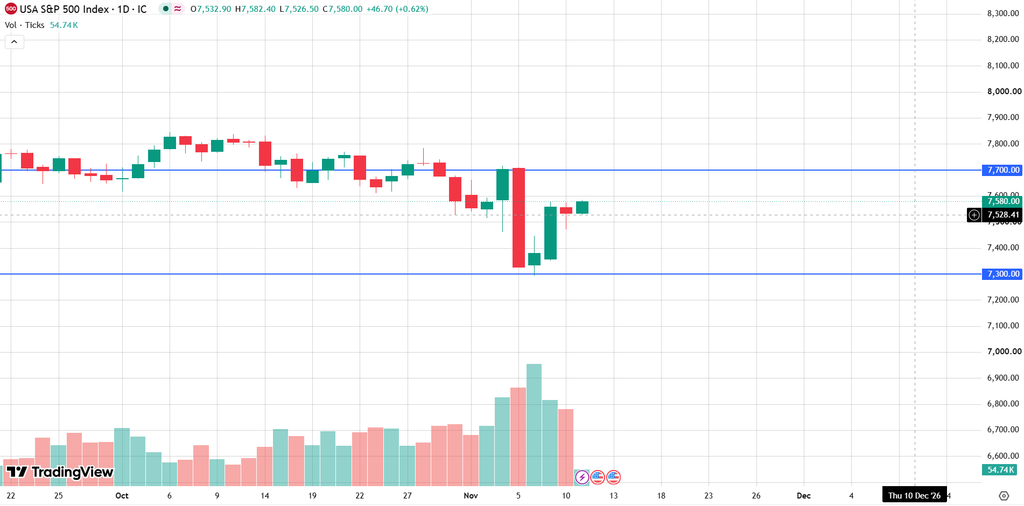
The analysts at Librrova review the S&P 500, the main benchmark of the American stock market, which is trying to stabilize near 7,500 points after a violent sell-off. The index has lost about 4% over the last month, and traders are asking whether this is the start of a deeper correction or only another routine pullback.
A Month Of Heavy Pressure
The decline has been sharp, especially in recent days. Over the last week the index lost more than 3%, and the heaviest blow came on Thursday, November 5, when it dropped by about 4.4%. That was the biggest one-day fall since April 2025, and it reminded investors how quickly sentiment can change.
A rebound followed at the start of this week, but Tuesday brought a small decline of around 0.4%, so the market still looks nervous. Moves like these suggest that buyers are present but not yet confident.
What Is Behind The Sell-Off
No single event explains the fall. Instead, several worries have combined. The first is a growing fear that expectations for artificial intelligence have run too far, and that spending on the technology may not bring the returns that investors have priced in.
The second is the outlook for interest rates and inflation, which remains uncertain. The third is the political and geopolitical background, including tension in the Middle East and the changes that followed the midterm elections on November 3.
These factors have produced wide swings. Energy, industrial and technology shares struggled amid concerns about slower AI investment and possible regulatory changes. At the same time, hopes for lower inflation and cheaper oil, especially if the conflict in the Middle East eases, supported real estate, financial and consumer companies.
The Weight Of Big Technology
One reason the index reacts so strongly to AI news is its structure. The S&P 500 is weighted by market value, so the largest companies have the greatest influence. Technology firms account for close to 40% of the index, and that figure ignores companies such as Amazon, Alphabet and Meta Platforms, which are classified in other sectors even though they depend heavily on technology.
At the top of the list, Nvidia carries a weight of roughly 8%, Apple about 7% and Microsoft close to 6%. Because of this concentration, a drop in a few giants can pull the whole index lower, even when many smaller companies are holding up.
A Calmer Long-Term View
Not everyone is alarmed. Optimists remind investors that the index has delivered an average yearly return above 10% since 1957, a period that included ten recessions and eleven bear markets. During the last four bear markets, the peak-to-trough declines were about 49%, 57%, 34% and 25%, and people who bought during those periods were usually well rewarded.
The estimated chance of a recession in the next twelve months is around 25% according to one major bank’s research team. This is a modest risk and not a forecast, but it shows that a serious downturn is not the base case.
Diversification Matters
For investors who worry about concentration, a common answer is to spread money more evenly. Sector funds can help to fill gaps in areas such as energy or finance, and assets outside stocks, including bonds, gold and real estate, often move independently of equities. These ideas do not remove short-term volatility, but they can reduce the damage when one group of shares falls sharply.
Support And Resistance Levels
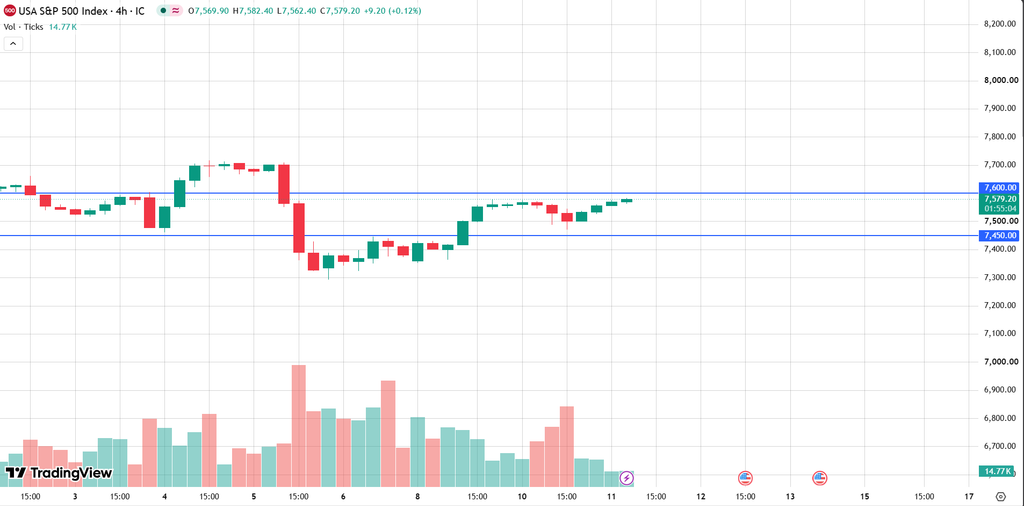
On the upside, the first resistance is the round figure of 7,600, followed by 7,700. A daily close above the second level would suggest that the sell-off has lost force and that buyers are regaining control.
On the downside, the first support is 7,500, close to the current price. Below it, 7,400 is the next level to watch, and the area near 7,300 would be a deeper test. A break under it could mean that the correction is extending.
What Traders Can Do
After such a large drop, volatility is likely to remain high, so a careful approach is sensible. Buyers may wait for a daily close above 7,600 before opening long positions, with targets near 7,700 and a stop-loss under 7,500. Sellers may look for a close under 7,500, aiming for 7,400, and should be ready for sudden rebounds.
Keeping position sizes small is wise, since a single day can move the index by several percent. Watching Nvidia’s results and the next inflation and interest rate news can add context, because both can change the mood of the market within minutes.
Conclusion
The S&P 500 is stabilizing near 7,500 after its worst day in more than a year, with AI fears, rates and geopolitics all in play. The 7,600 resistance and the 7,500 and 7,400 supports are the levels to follow.
Traders following Indices strategies should watch technology stocks, inflation data and the reaction at these levels, since these factors are likely to guide the next move in the index.