

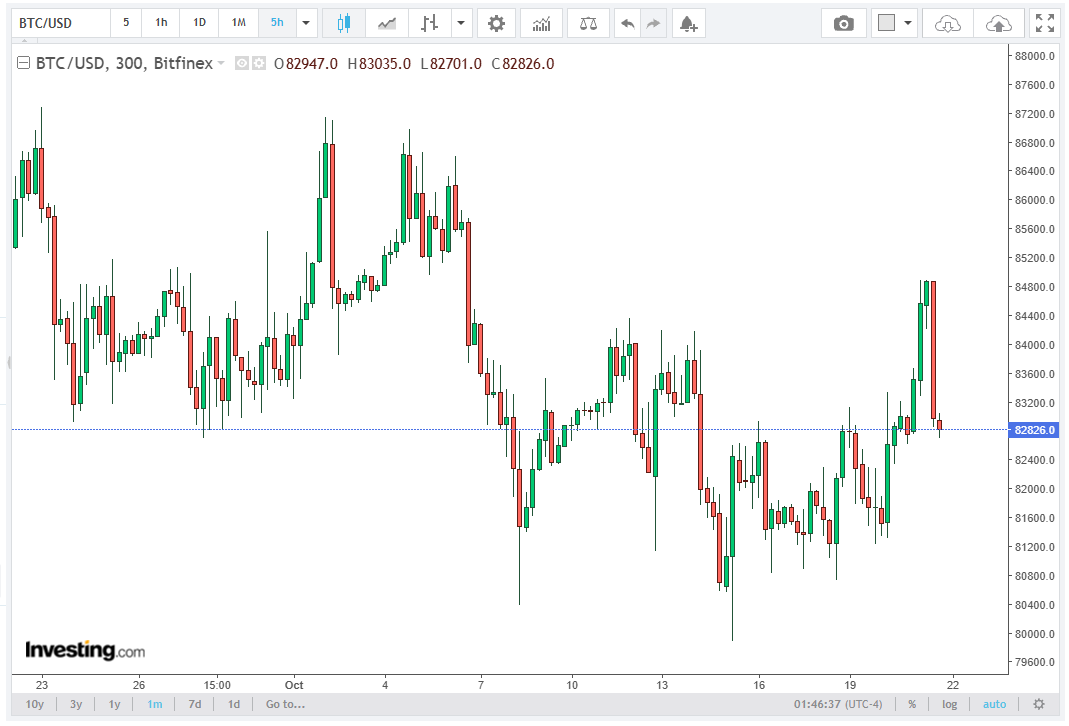
Bitcoin (BTC/USD) recovered toward 82,655-82,725, rebounding from the $79,870 swing low as improving risk appetite supported cryptocurrency demand. The recovery represents an advance of approximately 3.6%, suggesting that buyers are defending the $80,000 psychological support zone.
In the following article, Mynattaro’s analysts examine the key aspects of the subject and provide valuable insights.
The latest price action signals a potential transition from bearish momentum to bullish consolidation. The key question is whether BTC/USD can maintain its position above 82,000-83,000 and generate sufficient buying pressure to challenge higher resistance levels.
Macroeconomic conditions remain influential. The Dow Jones gained 512 points, while the Nasdaq 100 advanced 60 points. Meanwhile, the US 10-year Treasury yield declined to 5.127%. Brent crude retreated from $111 to $108 per barrel, while West Texas Intermediate (WTI) fell to approximately $98.
Despite improving sentiment, geopolitical uncertainty persists. Disruptions around the Strait of Hormuz could push energy prices higher, intensify inflation concerns, and increase volatility across Bitcoin and other risk-sensitive assets.
Institutional Demand Strengthens the Bitcoin Market
Bitcoin exchange-traded funds (ETFs) have attracted more than $800 million in inflows this year, according to the supplied figures. BlackRock’s iShares Bitcoin Trust (IBIT) remains a major contributor, with assets under management exceeding $66 billion.
Corporate accumulation provides additional support. Strategy holds 848,517 BTC, while Strive holds 36,818 BTC. Strive also acquired 7,328 BTC, reportedly valued at more than $600 million, following its SATS public offering.
Sustained ETF inflows and corporate purchases can absorb selling pressure and strengthen market sentiment. Confirmation would come from rising spot trading volume, improving market breadth, and a sustained breakout above resistance.
Falling Wedge Pattern Signals a Potential Bullish Breakout
The daily BTC/USD chart shows a recovery from $79,870 toward $82,700, alongside a developing falling wedge pattern. This formation consists of converging downward-sloping support and resistance trendlines, with price fluctuations narrowing as the pattern develops.
A falling wedge is commonly interpreted as a bullish reversal pattern when price breaks above its upper trendline. The narrowing structure can indicate weakening selling pressure and a potential shift toward buyer control.
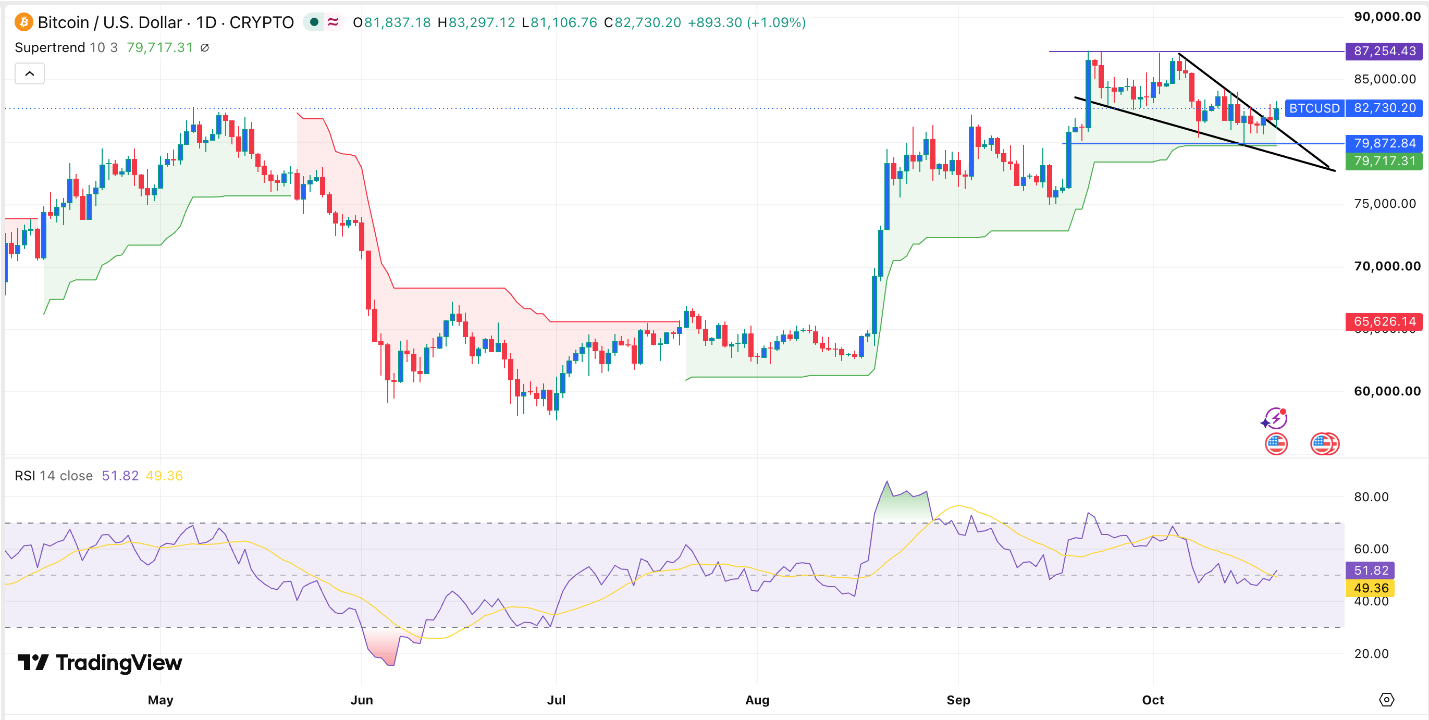
For confirmation, BTC/USD needs a daily candle close above the wedge’s upper boundary, ideally accompanied by increasing trading volume. A breakout without volume expansion carries a greater risk of failure.
The $79,870 swing low remains a critical invalidation level. A decisive decline below it would weaken the recovery structure and expose Bitcoin to additional downside.
Supertrend, EMA and RSI Confirm Improving Momentum
The Supertrend indicator provides a significant bullish signal. According to the supplied analysis, BTC/USD has remained above it since July, suggesting that the broader trend structure continues to favor buyers.
Supertrend uses the Average True Range (ATR) to calculate dynamic trend boundaries. Trading above the indicator generally signals an uptrend, with its trailing level potentially acting as dynamic support. A confirmed break below it would indicate deteriorating momentum.
The 50-day Exponential Moving Average (EMA) offers additional confirmation. Bitcoin’s position above this moving average suggests that its price remains stronger than its recent exponentially weighted average, supporting the intermediate-term bullish outlook.
Momentum is also improving. The Relative Strength Index (RSI) has moved above 50, indicating a shift toward positive momentum. A further advance toward 60–70, without a bearish divergence, would strengthen the recovery thesis. A return below 50 would signal weakening momentum.
Together, Supertrend support, price above the 50-day EMA, and RSI above 50 support an upside continuation scenario, provided the falling wedge produces a confirmed breakout.
BTC/USD Price Targets: $87,254 and $90,000
The immediate resistance target is $87,254, approximately 5.5% above $82,725. A sustained daily close above this level would strengthen the bullish continuation scenario and open a potential path toward $90,000, approximately 8.8% above the current reference price.
On the downside, $82,000 represents initial short-term support, followed by the $79,870 swing low. A break below $82,000 would weaken the recovery, while a decisive move below $79,870 would undermine the bullish reversal setup.
Traders should monitor daily closing prices, breakout volume, RSI readings, Supertrend levels, and ETF flows. Effective risk management requires a defined entry, a technically justified stop-loss, and an assessment of the potential risk-to-reward ratio before entering a position.
Conclusion
BTC/USD maintains a cautiously bullish technical outlook, supported by the falling wedge, Supertrend indicator, 50-day EMA, and RSI above 50. A confirmed breakout could propel Bitcoin toward $87,254, followed by $90,000 if buying momentum strengthens.
Failure to overcome resistance or a breakdown below $79,870 would weaken the bullish thesis. Ultimately, volume-confirmed price action and momentum alignment will determine whether the current recovery develops into a sustained upward trend.