

Gold had a weak session on Tuesday, falling by almost two percent and reminding investors that even the most famous safe haven can lose ground when interest rates and the dollar move the wrong way. The analysts at Vestronyx review the latest picture for the metal, which trades near $4,047 per ounce, and the levels that may decide the next move.
Gold Falls Back After A Sharp Daily Drop
The metal is down about 1.7% on the day, a loss of roughly $70 per ounce, and it now changes hands just above the $4,000 mark. That is a meaningful move for an asset that is often seen as slow and steady, and it shows how sensitive gold has become to changes in the economic outlook.
Rates And The Dollar Keep Pressure On Prices
The main force behind the decline is the outlook for US interest rates. On October 28, the Federal Reserve chose to keep its policy rate where it was, between 3.75% and 4.00%. The next meeting takes place on December 9, and futures markets currently put the chance of a quarter-point increase at about 81%.
This matters because gold pays no interest. When rates rise or are expected to rise, investors can earn more from bonds and cash, and the metal becomes less attractive by comparison. A stronger dollar adds to the problem, because gold is priced in dollars and becomes more expensive for buyers who use other currencies.
Oil And Inflation Complicate The Safe-Haven Story
Gold normally benefits from conflict and uncertainty, and the situation in the Middle East would seem to support it.
This time, however, the link is less simple. Expensive oil feeds inflation, and higher inflation can push the central bank to keep rates high, which supports the dollar and bond yields. In that chain of events, a further escalation of tension does not automatically lift gold, because the effect of costly energy can work in the opposite direction.
Softer inflation and cheaper oil would do the opposite, easing the pressure on the Fed and helping gold recover.
Central Banks And Funds Offer A Cushion
There are also factors that limit the downside. The People’s Bank of China bought roughly 23 tonnes of bullion in September, its 23rd consecutive month of additions. Gold-backed exchange-traded funds, for their part, still manage very large pools of metal despite the recent price slide.
This steady demand does not stop short-term declines, but it helps explain why dips often attract buyers.
What The Four-Hour Chart Shows
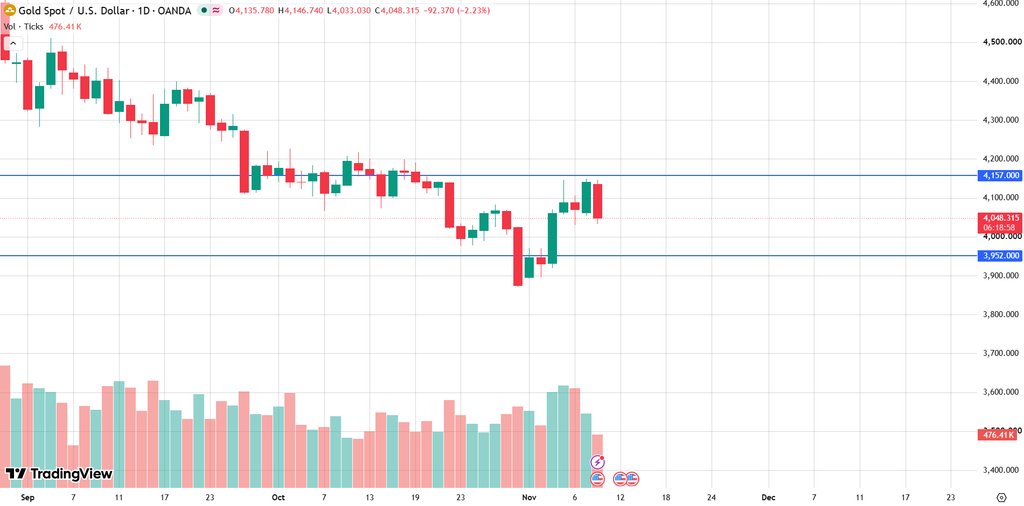
Short-term charts give a mixed message. Between about $4,114 and $4,135, the four-hour candles formed a rising three methods pattern, a formation that normally describes a brief pullback inside a bigger advance. The latest drop has put that reading to the test.
Momentum tools are not helping either side. The MACD line is drifting flat around zero, so the market lacks direction and keeps moving in a range.
The RSI reads about 56, which is neutral, while the Money Flow Index is edging up and hints at slow buying interest. Meanwhile, the price sits between the VWAP and the 20-period simple moving average, a position that fits a short-lived equilibrium between the two camps.
Data Releases That Could Move Gold
This is a busy week for macroeconomic news. Today brings the US consumer price report for October, along with weekly employment data. Jobless claims follow on November 12, and producer prices are due on November 13.
Each of these releases can change the way traders see the Fed’s next move, so volatility may stay high throughout the week.
Support And Resistance Levels
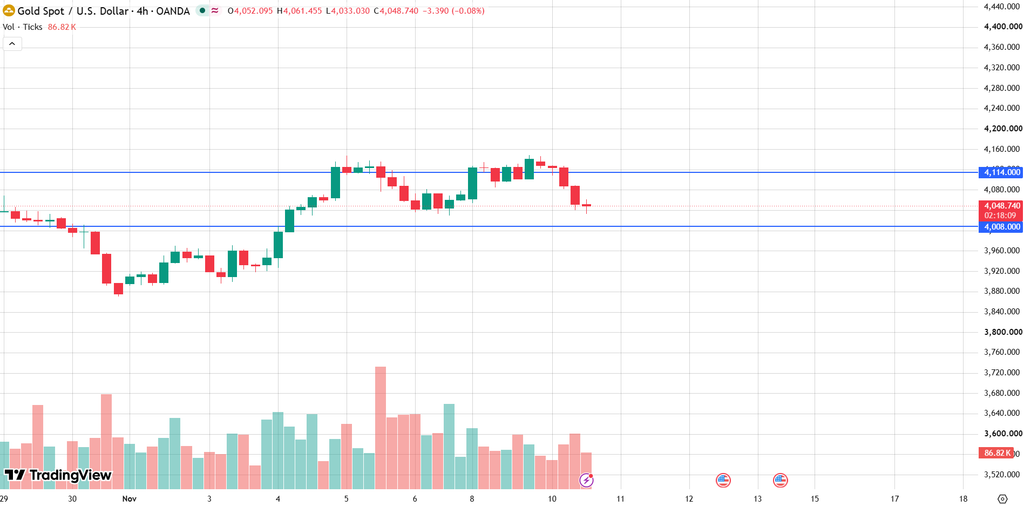
On the upside, the first resistance is near $4,114, followed by $4,157. A clear move above the second level would suggest that buyers are regaining control, with $4,202 as the next target.
On the downside, the first support is $4,058, with deeper floors at $4,008 and $3,952. A break below those levels could open the way toward $3,894 and the round figure of $3,800.
What Traders Can Do
With so much data ahead, many traders may prefer to wait for the first reaction to the inflation report before opening a position. A quick jump in either direction is common, and the first move does not always last.
A move above $4,157, supported by strong volume, would favor buyers, who could then aim for $4,202. A drop below $4,114 or $4,058 on strong volume would favor sellers, who could target $4,008. Position size should stay moderate, and a stop-loss should be placed before entering, since the market can change direction within hours.
Conclusion
Gold is under pressure from rate expectations and a firmer dollar, but central bank buying and fund holdings limit the room for a deeper fall. The $4,114 and $4,157 resistances and the $4,008 support are the levels to follow.
Traders following Commodities strategies should watch the inflation data, the dollar and bond yields, and the reaction at these levels, since these factors will probably guide the next move in gold.