

The USD/JPY pair extends its bearish correction, declining to a one-week low near 157.70 during the recent Asian session. The exchange rate is approaching the 157.50–157.00 support zone, which represents the lower boundary of its prevailing trading range.
With a focus on essential details, Mynattaro’s experts deliver a thorough examination of the subject in this article.
Persistent US Dollar (USD) weakness, declining US Treasury yields, and strengthening expectations of further Bank of Japan (BoJ) monetary tightening are weighing on the pair’s near-term trajectory.
The US Dollar Index (DXY) remains near a three-week low, reflecting a retracement in US yields following their advance to multi-year highs. Lower Treasury yields reduce the relative yield advantage of Dollar-denominated assets, weakening demand for the Greenback and increasing downside pressure on USD/JPY.
The pair’s inability to recover above nearby technical resistance indicates that selling interest remains dominant.
The Japanese Yen (JPY) is gaining support from expectations that the BoJ could deliver another interest-rate increase, potentially as soon as December.
Monetary Policy Divergence and Intervention Risks
The outlook for USD/JPY is increasingly influenced by the potential narrowing of the US-Japan yield differential. A more restrictive BoJ policy stance could reduce the attractiveness of Yen-funded carry trades, encouraging investors to unwind positions that have historically favored higher-yielding US assets.
Japanese foreign-exchange intervention risks also remain relevant as USD/JPY trades at elevated levels. The possibility of official action to counter excessive currency volatility may discourage speculative Dollar buying and reinforce demand for the Yen.
On the US side, markets continue to price in approximately a 90% probability of another Fed rate increase by year-end, reflecting persistent inflation concerns associated with volatile energy prices. Expectations of tighter monetary policy could support US yields and limit the Dollar’s losses.
At the same time, escalating Middle East geopolitical tensions may sustain safe-haven demand for the Greenback, creating a counterweight to the prevailing bearish trend.
Technical Analysis: 157.50 Emerges as Critical Support
From a technical perspective, USD/JPY retains a bearish short-term structure while trading below the 50.0% Fibonacci retracement at 158.47. The pair’s breakdown below the 100-period Simple Moving Average (SMA) on the four-hour chart, near 158.07, signals deteriorating trend strength and reinforces the negative momentum profile.
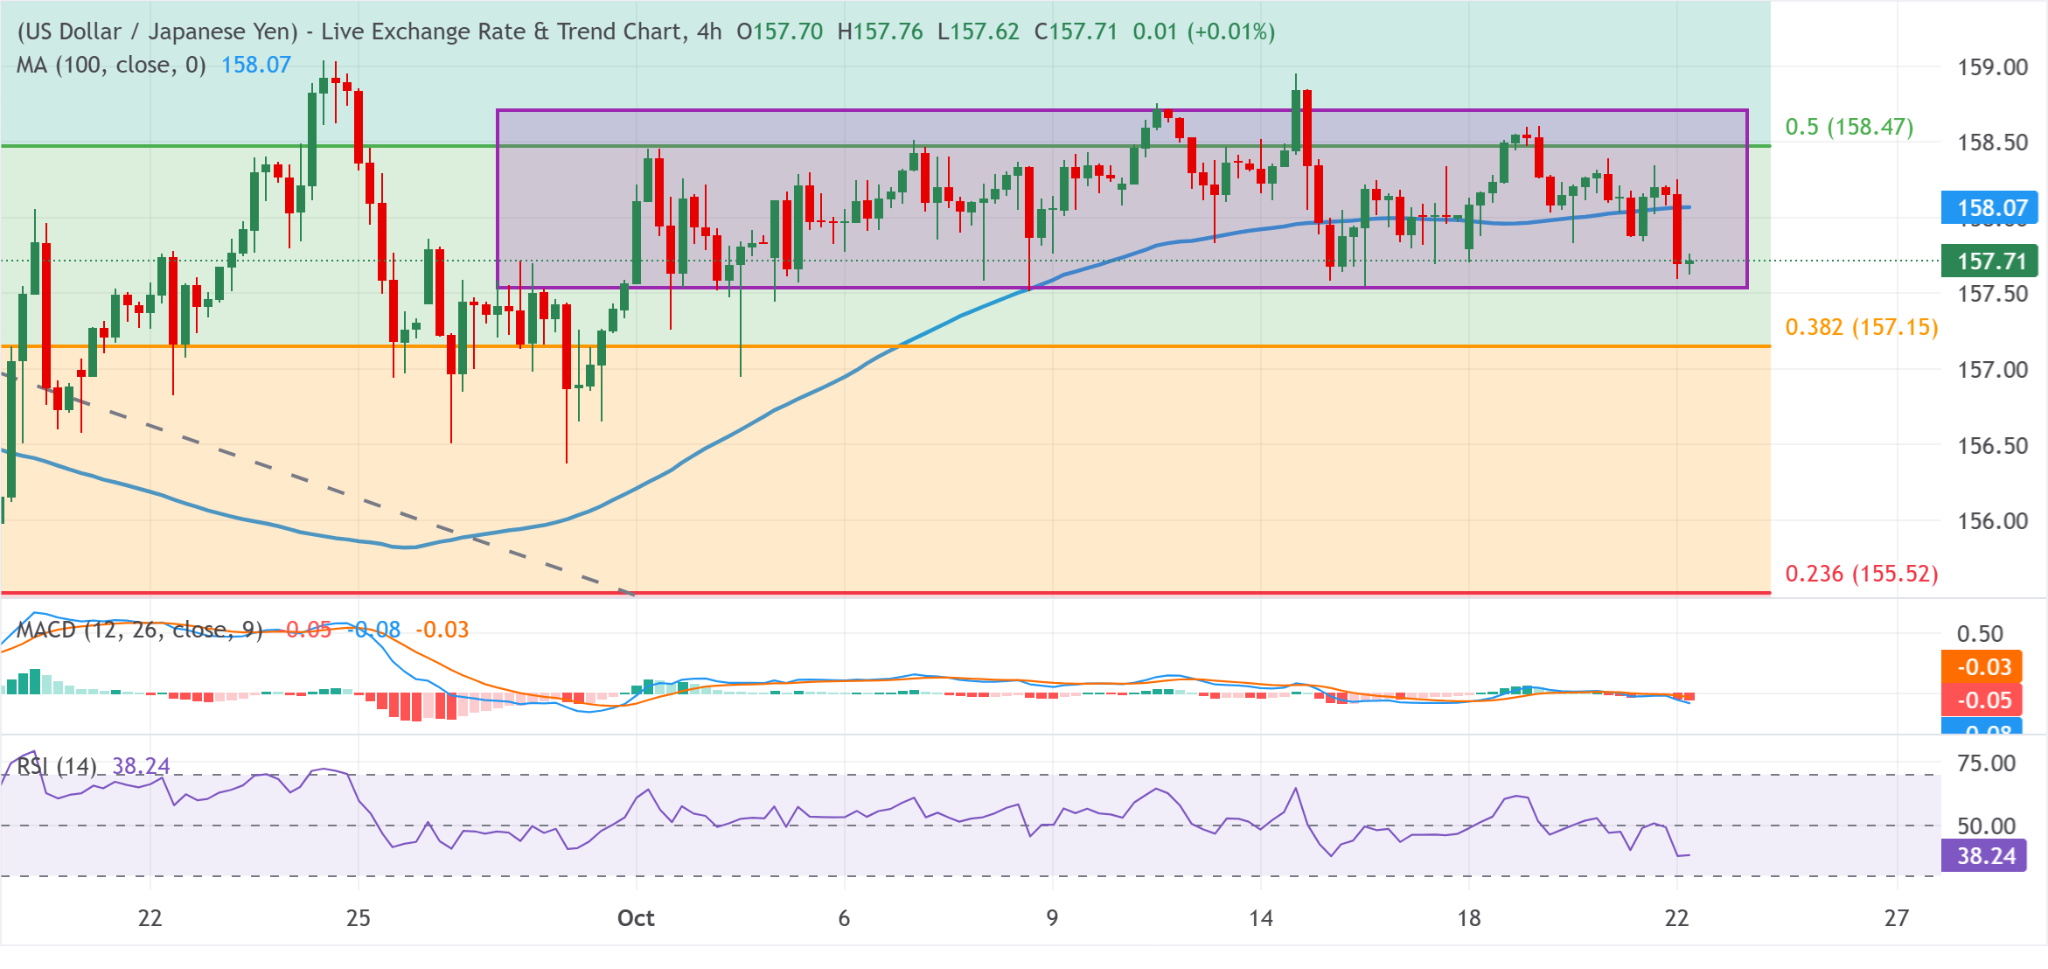
The Relative Strength Index (RSI) at 38.24 remains below the neutral 50 threshold, indicating that selling pressure exceeds buying momentum. Although the indicator has not entered the conventional oversold region below 30, its current reading suggests scope for additional downside before a stronger technical rebound becomes more likely.
Meanwhile, the Moving Average Convergence Divergence (MACD) line remains below the zero line, confirming negative momentum. The combination of a sub-50 RSI, negative MACD positioning, and price trading below the 100-period SMA supports a continuation of the near-term bearish bias.
The immediate technical focus is the 157.50–157.00 trading range support zone. A decisive four-hour close below 157.50, followed by sustained trading beneath the lower boundary, would provide stronger confirmation of a bearish range breakdown.
Initial downside exposure would then extend toward the 157.15 Fibonacci retracement, identified as the 38.2% level.
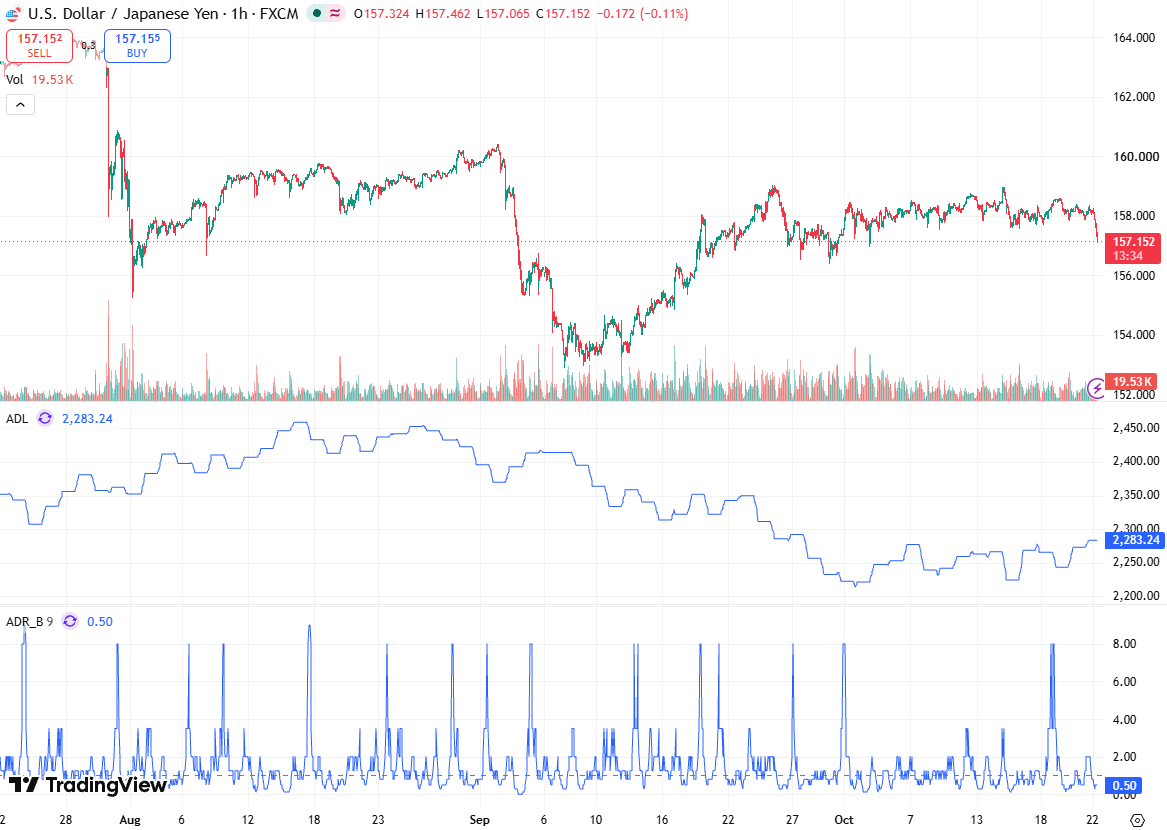
Further selling could expose 155.52, corresponding to the 23.6% retracement, followed by the 152.88 swing-low reference if bearish momentum accelerates and broader market conditions remain supportive of Yen appreciation. These targets represent progressively deeper downside scenarios rather than confirmed price objectives.
Resistance Levels and Bearish Invalidation
On the upside, immediate resistance is located at the 100-period SMA near 158.07. A recovery above this moving average would indicate improving intraday momentum, although the broader bearish structure would remain intact beneath 158.47, the 50.0% Fibonacci retracement.
A sustained break above 158.47 would weaken the immediate bearish outlook and shift attention toward 159.79, the 61.8% Fibonacci retracement. Additional resistance is positioned at 161.66, corresponding to the 78.6% retracement. A move toward these levels would require a meaningful improvement in Dollar demand and a recovery in bullish momentum indicators.
Price behavior around 157.50 support and the 158.07–158.47 resistance band will therefore be instrumental in determining the next directional move. A failed breakdown could preserve the existing range, while a confirmed breach of support would increase the probability of an extended corrective decline.
Conclusion
The USD/JPY forecast remains bearish below 158.47, with declining US Treasury yields, hawkish BoJ expectations, and intervention risks favoring further Yen appreciation. The 157.50 support threshold is the immediate technical trigger: a confirmed breakdown could expose 157.15, 155.52, and potentially 152.88.
A recovery above 158.07 would ease immediate selling pressure, while a sustained move above 158.47 would weaken the bearish setup. Momentum indicators, Treasury yields, and central bank guidance remain the principal variables governing the pair’s next move.