
Gold (XAU/USD) advanced during Tuesday’s Asian session, extending a short-term rebound within a broader corrective structure. The move higher reflects a recalibration in macro risk premia, with markets rapidly adjusting expectations for geopolitical risk, inflation sensitivity, and policy path probabilities. This article offers a detailed and easy-to-understand overview of the subject, presented by Rubizio brokers.
Price action remains volatile but contained, with intraday gains occurring inside a still-defined bearish technical regime. Spot gold continues to trade below key medium-term trend thresholds, suggesting that the current bounce is liquidity-driven rather than trend-reversing.
Rates Market Repricing: Fed Probability Shift and Yield Compression
The macro transmission from geopolitics to rates has been immediate. Interest rate derivatives show a clear dovish repricing in the probability distribution of future Federal Reserve actions.
The CME FedWatch Tool shows that expectations for another interest rate increase by December have eased noticeably. The market-implied chance has dropped from roughly 70% down to 58%, indicating a 12-point reduction in anticipated monetary tightening within the span of just one week.
This repricing is driven primarily by the expected decline in energy-driven CPI volatility, as oil stabilisation reduces near-term headline inflation risk. Markets are therefore shifting focus from inflation persistence toward growth moderation and policy pause duration.
The upcoming policy decision is widely priced for a hold in the 3.50%–3.75% range, reinforcing the idea that the policy terminal rate is likely closer to a plateau than an extension cycle.
Cross-Asset Transmission: Dollar, Yields, and Oil Correlation Breakdown
The geopolitical easing has triggered a synchronized adjustment across major macro assets.
US Treasury yields declined modestly as inflation expectations compressed, particularly in the 2-year and 10-year segments, which are most sensitive to policy expectations. This decline reduces the opportunity cost of holding gold, historically one of the strongest inverse correlations in bullion pricing models.
Simultaneously, the US dollar index (DXY) weakened as risk sentiment improved and rate differential expectations narrowed. A softer dollar mechanically supports XAU/USD expansion, particularly through emerging market demand elasticity.
Crude oil prices also retreated as supply disruption probabilities fell, reducing embedded geopolitical supply premiums. The oil decline reinforces disinflation expectations, further tightening the feedback loop between energy markets and monetary policy pricing.
Collectively, these movements represent a classic risk compression regime, where safe-haven assets like gold respond not through liquidation, but through repositioning of macro hedges.
Technical Structure: Bearish Regime Still Dominant Despite Rebound
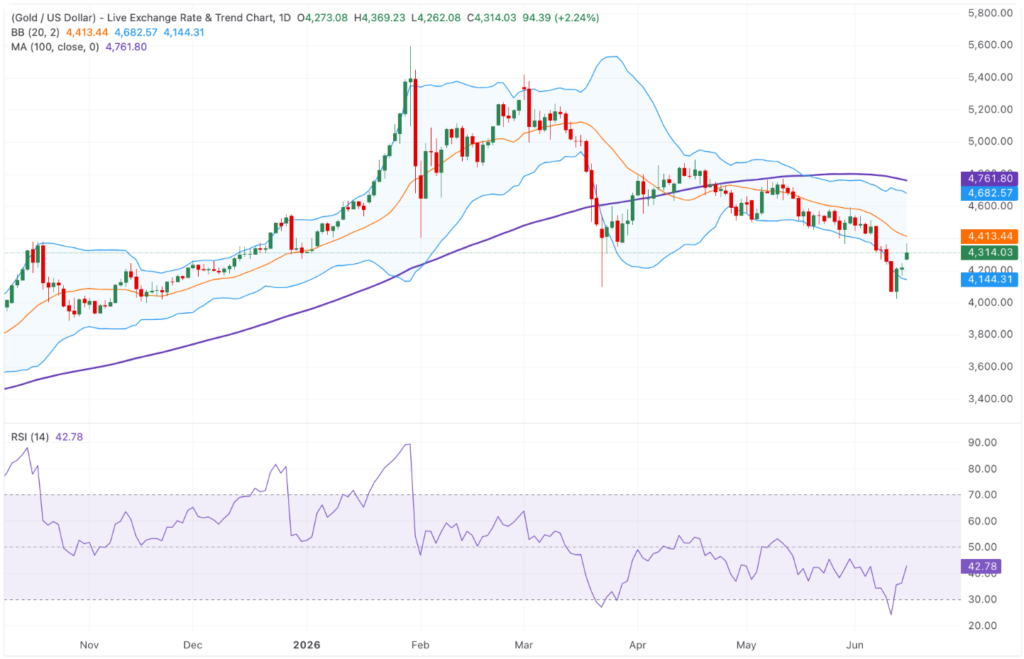
Despite the short-term recovery, gold (XAU/USD) remains technically capped within a broader bearish trend structure on the daily timeframe.
Price continues to trade below the 100-day Simple Moving Average (SMA), currently positioned near the $4,760 zone, which acts as a significant dynamic resistance band. This positioning confirms that the medium-term trend remains downward-biased.
Volatility envelopes also reinforce this structure. XAU/USD is still trading below the Bollinger Band midline (~$4,415), indicating that mean reversion strength has not yet been sufficient to re-establish bullish regime control.
Momentum indicators remain subdued. The Relative Strength Index (RSI) is hovering near 43, below the neutral 50 threshold, signaling persistent negative momentum skew, even as short-term buying pressure emerges.
Key Price Levels: Defined Resistance and Fragile Support Architecture
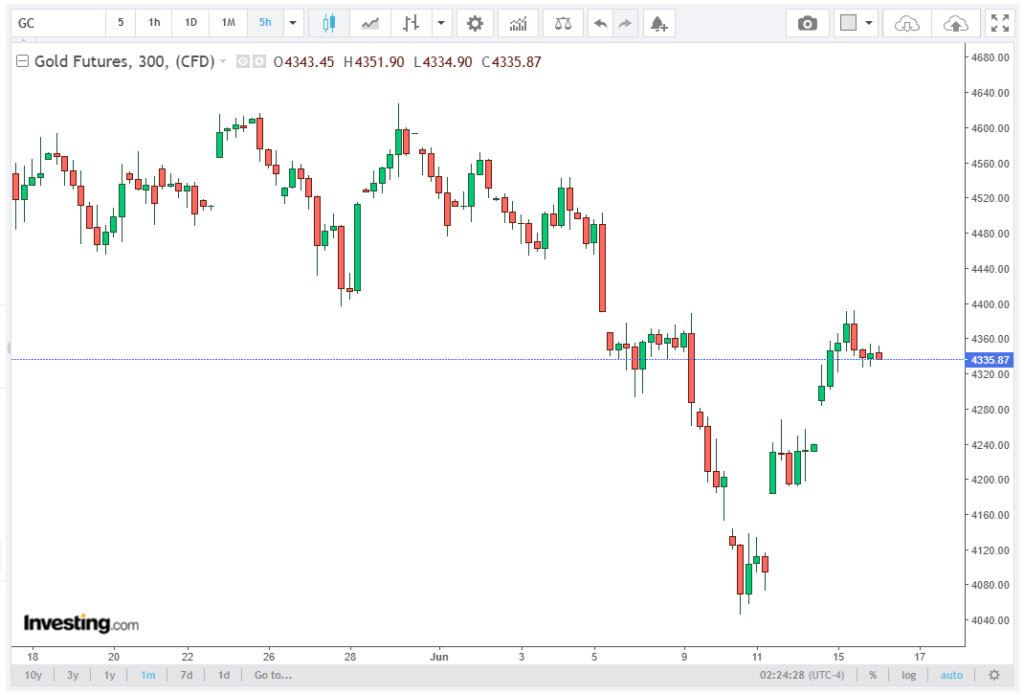
On the upside, immediate resistance is established at the $4,363 level, corresponding to the June 9 swing high. This level represents the first structural barrier for continuation momentum.
Beyond this, the $4,415 Bollinger midline becomes the key equilibrium threshold. A sustained break above this zone would be required to shift price behavior from bearish retracement to neutral consolidation.
Further resistance is layered at the upper Bollinger Band near $4,685, followed by the 100-day SMA near $4,762, forming a dense supply cluster that would likely require a significant macro catalyst to overcome.
On the downside, the first major support sits at the $4,145 lower Bollinger Band, which defines the current volatility floor. A breakdown below this level would signal renewed downside momentum and potentially reintroduce a move toward prior structural lows, accelerating trend continuation risk.
Macro Outlook: Policy Event and Risk Repricing Equilibrium
The near-term outlook for gold is defined by a dual-anchor framework: monetary policy stability and geopolitical de-escalation credibility.
If the Federal Reserve maintains a steady policy stance while inflation expectations continue to moderate, real yields are likely to drift lower, providing structural support for bullion.
However, gold’s upside remains technically constrained unless price reclaims the $4,415–$4,760 resistance corridor, which currently defines the transition zone between bearish continuation and bullish reversal.
In the interim, the market is operating in a macro compression phase, where gold reacts primarily to shifts in rate expectations, dollar liquidity conditions, and geopolitical headline sensitivity, rather than sustained directional trend formation.