
The Silver price (XAG/USD) continues to trade in a clearly defined bearish technical regime, slipping toward $69.85 during early European trading hours on Tuesday. The move extends a broader corrective phase that has developed after repeated failures to sustain levels above the $72.00–$74.00 supply zone. In this article, the brokers at Rubizio provide a clear and detailed overview of the subject.
M arket structure remains tilted to the downside as price action is still positioned beneath both the 20-day SMA and the more influential 100-day SMA, confirming that the dominant trend bias remains negative.
The inability of silver to reclaim the $70.00 psychological level in a sustained manner reinforces weak spot demand and highlights persistent distribution pressure. Intraday rebounds continue to be sold into, suggesting that short-term positioning remains skewed toward range-to-downside continuation rather than trend reversal.
Trend and Moving Average Dynamics
Technically, the most critical structural element remains the positioning of price relative to key moving averages. The 100-day SMA near $78.55 continues to act as a long-term dynamic resistance level, while the 20-day SMA around the low $72.00 region forms the first layer of overhead supply.
Price trading below both moving averages confirms a bearish trend alignment across short and medium timeframes. Historically, sustained bearish phases in silver tend to persist until price reclaims and stabilizes above the 20-day SMA, followed by a successful retest of the 100-day SMA. Neither condition is currently met.
The slope of the 100-day SMA (Simple Moving Average) remains mildly downward, reinforcing the broader structural weakness. This alignment suggests that rallies are still occurring within a distribution channel, where upward extensions are likely to face systematic selling pressure.
Momentum Indicators and Volatility Positioning
The RSI 14 is just below 50, showing neutral-to-bearish momentum. This matters because RSI staying below equilibrium suggests weak bullish strength and no clear trend reversal.
RSI also fails above 55–60, which usually signals early bullish acceleration. Instead, repeated rejection shows weak momentum continuation, not a reversal.
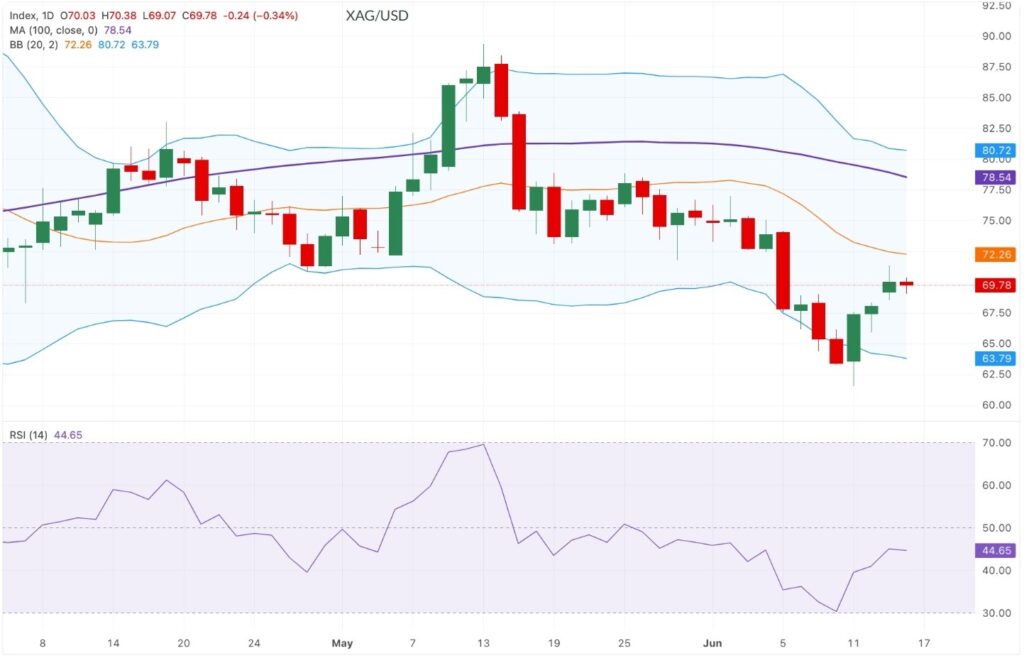
Bollinger Bands confirm pressure: price sits in the lower half of the band and keeps failing at the 20-day mid-band (~$72.25). This level acts as dynamic resistance.
Overall, the structure shows compression in a downward-tilted channel, with downside risk dominant unless price reclaims the mid-band with strong volume.
Key Technical Levels and Price Zones
The most immediate resistance remains the $72.25 level, which aligns with the Bollinger Band midline and represents the first structural barrier for any corrective rebound. A sustained break above this zone would be required to neutralize short-term bearish pressure and open the path toward higher retracement levels.
Above this, the next significant resistance is located at $74.14, marking the most recent swing high and a key rejection point within the current corrective cycle. A breakout above this level would signal a shift toward broader mean reversion, potentially targeting the $78.55 region, where the 100-day SMA converges with historical supply.
Further upside extension beyond $78.55 would bring the upper Bollinger Band near $80.72 into focus, representing the upper boundary of the current volatility channel. However, such expansion would require a strong shift in macro momentum and a decisive break of multi-layer resistance.
On the downside, immediate structural support is located at $63.80, aligned with the lower Bollinger Band. This level represents a statistically significant volatility boundary where price historically tends to stabilize during corrective phases. A breakdown below this zone would indicate an acceleration of bearish momentum and open the possibility of a deeper structural retracement phase beyond the current consolidation range.
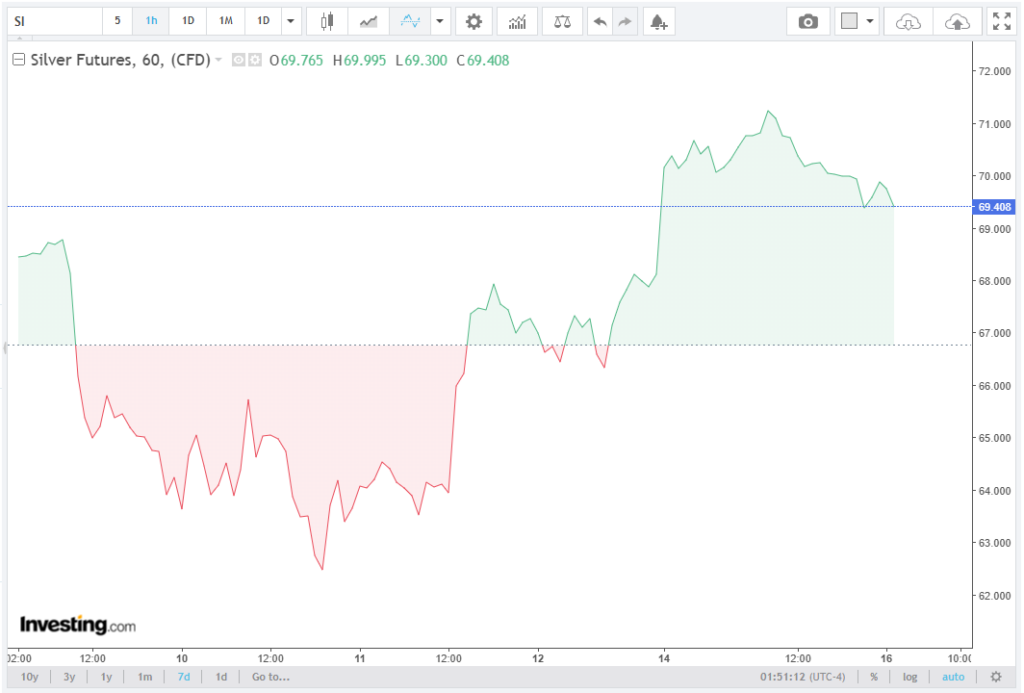
Short-Term Price Behavior and Market Positioning
Silver is in a controlled bearish consolidation, not a high-volatility liquidation. Price is compressing between $69.00–$72.25, showing a balance between short-covering and selling pressure.
Failure to reclaim $70.00–$72.00 on a close reinforces continued downside bias. Market stance remains defensive, with traders waiting for macro catalysts before committing directionally.
Volume confirms weakness: up moves on low participation, while down moves carry stronger flow, signaling a lack of accumulation demand and persistent bearish control.
Forward Outlook and Technical Bias
The forward technical outlook for XAG/USD (Silver) remains bearish-to-neutral, with the dominant bias still controlled by positioning under the 100-day SMA (Simple Moving Average) and persistent rejection at the $72.25 mid-band level. Unless price reclaims and holds above this confluence zone, rallies are expected to remain corrective within a broader downward structure.
Momentum conditions remain insufficient to signal a reversal, while volatility positioning continues to favor downside continuation toward $63.80 in the event of renewed selling pressure.
Until a structural break occurs above $74.14, silver is likely to maintain a lower-high formation sequence, reinforcing the ongoing bearish trend cycle characterized by capped upside extensions and controlled downside drift.