
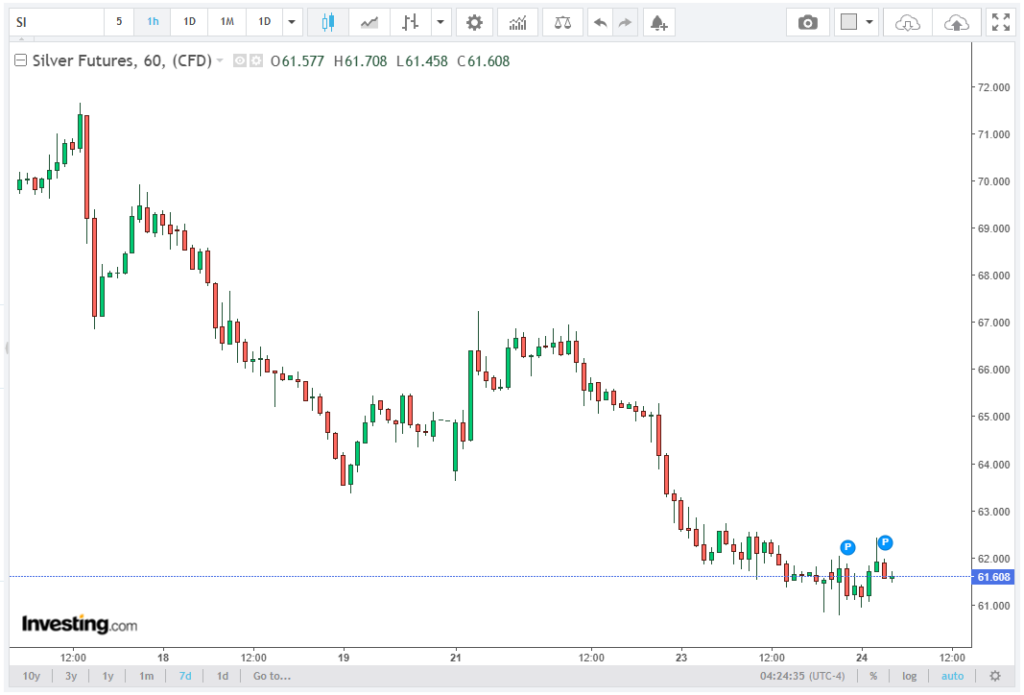
The Silver price (XAG/USD) is attempting a limited technical rebound after sliding to a fresh six-month low at $60.74 on June 24. During European trading hours on Wednesday, the metal is fluctuating near $61.70 per troy ounce, following a prior session decline exceeding -5.2%, confirming strong downside acceleration within the short-term trend structure. Vaulltier’s brokers explore this topic in depth in the accompanying article.
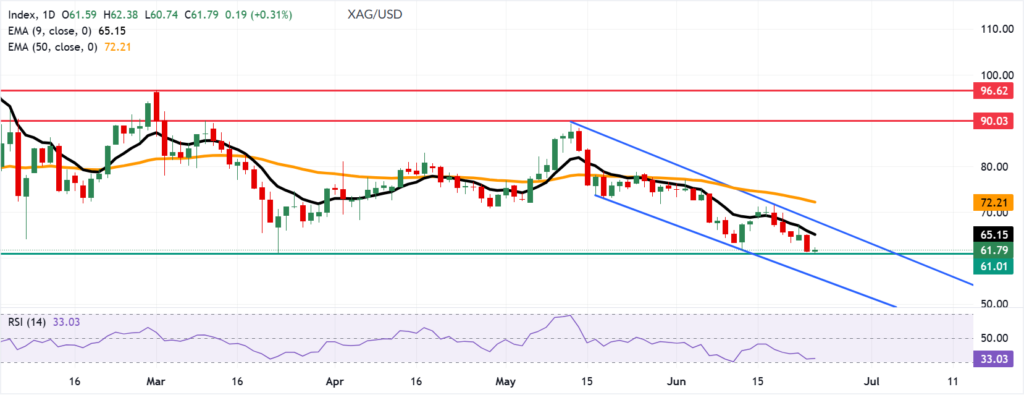
Despite the intraday recovery, the broader technical configuration remains firmly bearish, with price action still contained inside a well-defined descending channel that has governed movements since the last medium-term peak. The structure continues to print lower highs and lower lows, indicating persistent distribution pressure and lack of sustained buying interest.
Trend Alignment and Moving Averages
From a trend-following perspective, XAG/USD remains positioned below both the 9-period EMA at $65.15 and the 50-period EMA at $72.21, reinforcing a clearly defined bearish regime.
The gap between current price levels (~$61.70) and the 9 EMA ($65.15) reflects a short-term deviation of approximately +5.6%, while the distance to the 50 EMA ($72.21) represents a broader structural discount of roughly +17%, highlighting the strength of the prevailing downtrend.
The alignment of EMAs in a downward slope confirms that momentum remains skewed to the downside, with any upward corrections likely to face systematic supply pressure near dynamic resistance zones.
Descending Channel Dynamics
Price action remains confined within a multi-week descending channel, with the upper boundary currently aligned near $68.70 and the lower structural boundary projected toward $56.20.
The mid-channel equilibrium zone sits around $63.00–$64.00, an area where price is currently attempting stabilization. However, repeated failures to sustain levels above $65.00 reinforce the presence of strong overhead supply.
Channel geometry suggests that each successive rally has been capped at progressively lower levels, with slope compression indicating continued bearish volatility expansion potential toward the lower boundary.
A breakdown below $60.74 would statistically increase downside momentum acceleration, exposing a potential extension toward $58.00, followed by the broader channel support at $56.20, representing a projected downside range of approximately -8% to -12% from current levels.
Key Support and Resistance Mapping
Immediate support is anchored at the recent structural low of $60.74, which now serves as a critical short-term pivot. A confirmed daily close below this level would represent a continuation signal, reinforcing bearish control.
Below this threshold, liquidity voids suggest limited historical congestion until the $58.00 region, followed by a deeper structural zone near $56.20, which aligns with the lower boundary of the descending channel.
On the upside, the first meaningful resistance level is the 9-day EMA at $65.15, which coincides with prior intraday rejection zones. This level also aligns with short-term supply clusters formed during the last breakdown phase.
A sustained breakout above $65.15 would be required to neutralize immediate bearish pressure. However, stronger confirmation would only emerge above the $68.70 channel resistance, which marks the structural ceiling of the current downtrend.
Beyond this threshold, price would begin to invalidate the descending channel structure, opening a path toward the 50-day EMA at $72.21, which represents the dominant medium-term resistance and trend inflection zone.
Volatility and Price Behavior
Recent trading behavior shows an increase in intraday volatility compression followed by sharp directional expansion, a typical characteristic of late-stage bearish trends.
The -5.2% single-session decline reflects strong momentum-based selling, while the subsequent stabilization near $61.70 suggests short-term absorption but not accumulation.
Volume patterns (where observable) typically confirm that rebounds in this phase are driven by short covering rather than new long positioning, reinforcing the corrective nature of the current move.
Short-Term Technical Outlook
The near-term outlook for XAG/USD remains structurally bearish, with price action still governed by the descending channel and trading below both key EMAs.
As long as silver remains below $65.15, upside attempts are expected to remain capped and corrective, with repeated rejection risk near dynamic resistance levels.
A retest of $60.74 remains statistically likely, and a breakdown below this level would likely accelerate downside momentum toward $58.00, with extended risk toward $56.20 under sustained selling pressure.
Only a decisive breakout above $68.70 would shift the broader structure toward a neutral-to-bullish transition, with subsequent confirmation required above the 50-day EMA at $72.21 to invalidate the prevailing downtrend.
Conclusion
The Silver (XAG/USD) market remains in a clearly defined bearish technical structure, characterized by a persistent descending channel, sub-EMA trading conditions, and a weak but stabilizing RSI near 33. While short-term rebounds toward $62.00–$63.00 are technically possible, they remain corrective in nature unless price reclaims $65.15 with strong momentum confirmation.
Until then, downside risk toward $60.74, and potentially $56.20, continues to dominate the medium-term technical outlook.