
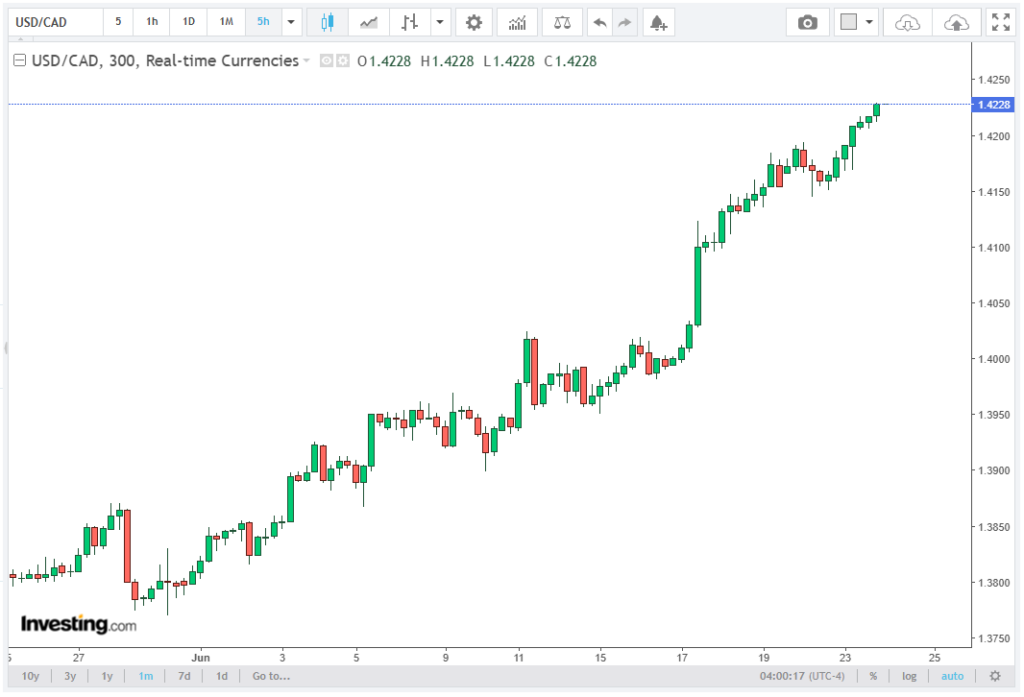
The USD/CAD pair continues to extend its bullish sequence, printing a fresh yearly high at approximately 1.4225 during Wednesday’s European session. The breakout above the 1.4200 psychological resistance confirms continuation of a medium-term impulsive wave that began from the 1.3600–1.3700 accumulation zone earlier in the year. The accompanying article features Rubinax’s brokers delving deeply into this subject.
Spot price action now remains firmly above the 10-week exponential moving average (EMA) at 1.3943, reflecting a sustained bullish regime. The current deviation from the EMA stands at nearly +280 pips, indicating strong directional momentum rather than mean-reverting behavior.
The pair’s structure shows a clear sequence of higher highs and higher lows, with the most recent demand pivot forming near 1.3960–1.4000, reinforcing trend integrity.
US Dollar Strength and Macro Yield Support
The dominant macro driver remains persistent US Dollar (USD) outperformance, with the US Dollar Index (DXY) trading near 101.50, its highest level in over 12 months. From a correlation standpoint, USD/CAD continues to track a high positive sensitivity to DXY strength, with a rolling beta estimated near 0.70–0.80 over recent months.
This USD appreciation is primarily anchored in sustained real yield support. The US 10-year real yield remains elevated in the +1.8% to +2.1% range, maintaining a significant spread versus Canadian equivalents, which remain lower by approximately 40–70 basis points depending on tenor.
This yield differential continues to generate structural inflows into USD-denominated assets, reinforcing carry-driven demand for the US Dollar and mechanically supporting upside pressure in USD/CAD.
Inflation Dynamics and PCE Sensitivity
The upcoming US Personal Consumption Expenditure (PCE) Price Index represents a high-volatility catalyst for USD/CAD pricing. Markets are particularly sensitive to the core PCE measure, which remains the Federal Reserve’s preferred inflation gauge.
Current market equilibrium implies a break-even core PCE trajectory near 2.6%–2.8% year-on-year. Any deviation above this band would likely reinforce expectations of prolonged restrictive policy, potentially re-pricing terminal rate assumptions higher by 10–20 basis points.
From a volatility standpoint, USD/CAD typically exhibits a 60–90 pip intraday range expansion around high-impact US inflation releases, with directional bias skewed toward USD strength when inflation surprises to the upside.
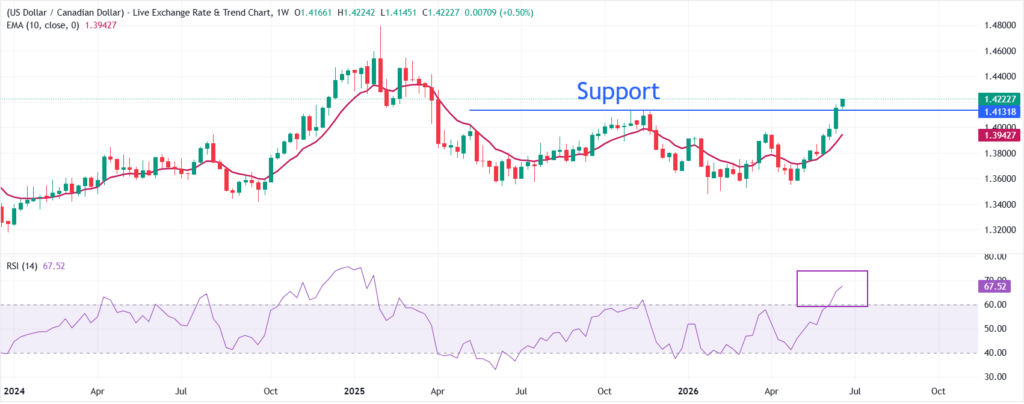
A sustained inflation print above consensus would likely extend momentum toward the 1.4296 resistance zone, while a downside surprise could trigger a corrective retracement toward 1.4140 support without necessarily invalidating the broader uptrend.
Technical Momentum and Indicator Profile
The Relative Strength Index (RSI) on the weekly timeframe is currently positioned near 67, approaching the classical overbought threshold of 70. Historically, USD/CAD trending regimes can sustain RSI readings between 65–75 for extended periods during strong directional phases, suggesting momentum exhaustion is not yet confirmed.
The MACD profile remains in positive territory with widening histogram bars, indicating increasing momentum divergence in favor of buyers. The slope of the 10-week EMA has accelerated to approximately +0.0045 per week, reinforcing trend acceleration characteristics.
Volatility-adjusted trend strength, measured via ATR expansion, shows a current 14-week Average True Range near 140–160 pips, with realized volatility trending higher by approximately 12% month-over-month, supporting breakout continuation conditions.
Key Price Levels and Structural Mapping
Immediate support is located at 1.4140, corresponding to the prior structural high from November 2025, now acting as a flipped support-resistance zone. Below that, dynamic support remains anchored at the 10-week EMA at 1.3943, which aligns closely with the 38.2% Fibonacci retracement of the current bullish leg.
A deeper retracement would expose the 1.3800–1.3850 liquidity zone, which represents a high-volume node from prior consolidation phases.
On the upside, price discovery is now focused on 1.4296, the April 2025 swing high. A confirmed breakout above this level would open a measured move projection toward 1.4415, based on a prior range extension model using a 1.0600–1.4200 expansion vector, implying continuation of trend symmetry.
Outlook and Trend Continuation Probability
The current macro-technical alignment continues to favor bullish continuation in USD/CAD, with probability-weighted models suggesting a 60%–70% likelihood of further upside extension in the near term, assuming no significant downside surprise in inflation data.
The dominant drivers remain intact: sustained USD yield advantage, elevated Fed policy divergence expectations, and structurally weak relative performance in CAD due to softer risk-linked capital inflows.
Unless upcoming inflation data materially shifts the real rate differential narrative, price action is likely to maintain a bullish trajectory with incremental targets toward 1.4296 and 1.4415.
Short-term corrections remain technically possible given elevated RSI conditions, but are expected to be shallow retracements within a broader bullish regime, rather than full trend reversals.