
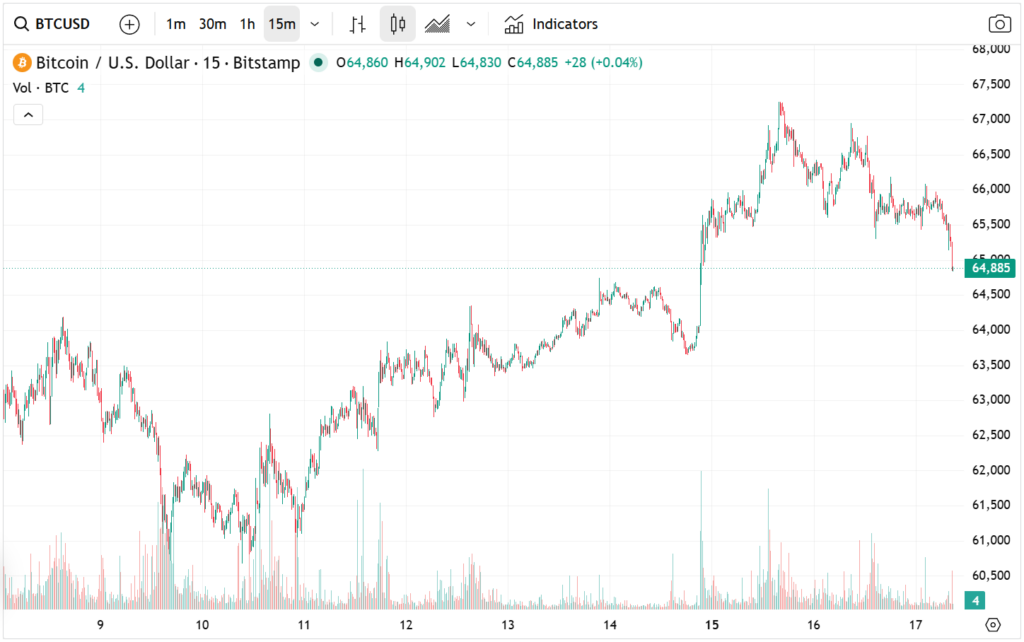
The BTC/USD pair is currently transitioning into a clear phase of volatility compression after a multi-week expansion cycle. Price action has contracted into a narrow intraday band around 65,000–66,500, following a rejection from the recent swing high at 67,200. In this article, Sollventis’ brokers present a structured overview of the subject
From a structural perspective, Bitcoin remains confined within a broader corrective range defined by the May high at 82,823 and the June low at 59,000, representing a total swing amplitude of approximately 23,823 USD.
The current mid-zone consolidation near 65,695 sits slightly below the 50% Fibonacci retracement level (~70,900) of the broader decline, indicating that recovery strength remains technically incomplete.
Macro Catalyst: FOMC Event Risk and Rate Expectations
The dominant driver for near-term BTC/USD volatility is the upcoming FOMC interest rate decision, with markets pricing a near-certainty of rates held in the 3.50%–3.75% corridor. Current implied probability for a rate hold is above 95%, based on rate futures positioning.
The key variable is not the rate level itself but the forward guidance trajectory, particularly the dot-plot sensitivity and inflation reaction function. Core inflation remains structurally above the 2% target band, with recent readings stabilizing closer to the 3.0%–3.4% annualized range, maintaining a restrictive policy bias.
Market participants remain split on forward policy bias: one cohort expects prolonged restrictive liquidity conditions, while another assigns a non-zero probability to additional tightening cycles if inflation persistence exceeds the 3% threshold.
This uncertainty is compressing BTC implied volatility, which has declined from recent highs near 68% annualized IV toward the low 60% region, reflecting pre-event positioning neutrality.
Liquidity Conditions: ETF Flow Divergence and Capital Rotation
A key structural headwind for Bitcoin spot demand is the persistent weakness in spot Bitcoin ETF flows. Net outflows have exceeded $4.3 billion over a rolling 60-day window, indicating sustained institutional de-risking.
This contrasts sharply with equity market inflows, where passive equity vehicles have absorbed more than $125 billion year-to-date, pushing total assets above $1 trillion in leading index funds. This divergence signals a clear cross-asset capital rotation regime, favoring equity beta over digital asset exposure.
The correlation between BTC/USD and liquidity expansion metrics remains elevated, with Bitcoin showing a beta sensitivity of approximately 2.1–2.5x relative to broad risk indices during liquidity-driven phases. However, current ETF outflows indicate a negative marginal liquidity impulse, which is capping upside continuation.
Exchange balance data also shows a mild increase in BTC inflows to centralized venues, suggesting partial profit realization after the +13,000 USD rebound from 59,000 to 67,200, reinforcing short-term supply pressure.
Technical Analysis: EMA Resistance and Pattern Structure
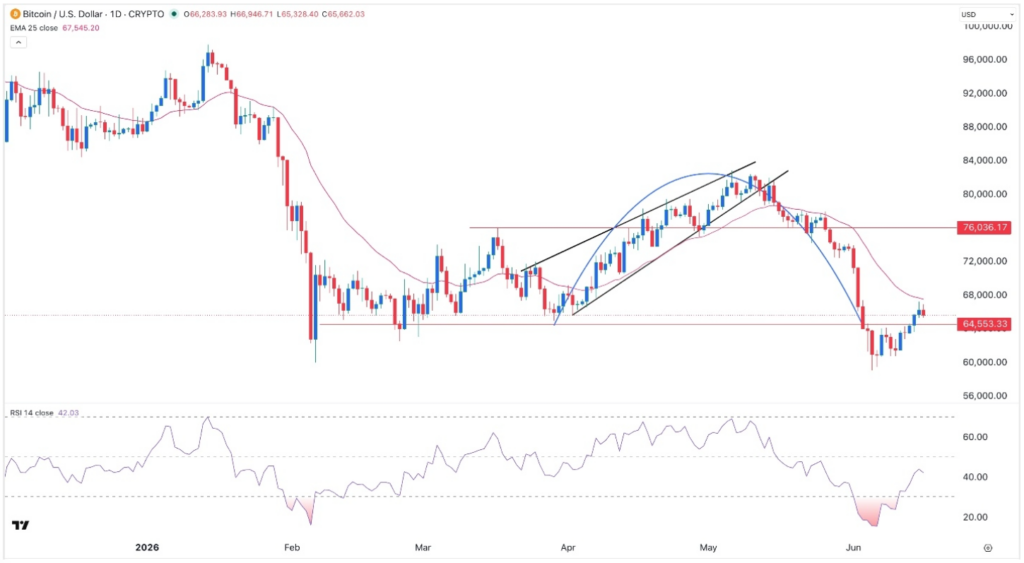
From a technical standpoint, BTC/USD remains below all major short- and medium-term trend filters. The most critical dynamic resistance is the 100-day Exponential Moving Average (EMA), currently positioned near the 67,800–68,200 zone, acting as a supply ceiling.
On the pattern side, Bitcoin is forming an inverted cup-and-handle continuation structure on the daily timeframe. The rounded top spans the 74,000–67,000 distribution arc, while the current handle consolidation is forming between 65,000 and 66,800.
Measured move projections for this structure indicate a potential downside extension equal to the prior base depth of approximately 8,000–9,000 USD, which aligns with a projected breakdown target zone near 59,500–60,500.
Momentum indicators reinforce this structure. The Relative Strength Index (RSI 14) has retreated from overbought rejection near 62–65 levels and is stabilizing closer to 48–52, indicating neutral-to-bearish momentum without bullish divergence confirmation.
Key Price Levels and Volatility Outlook
Immediate resistance remains anchored at 67,200–67,800, corresponding to the recent swing high and EMA confluence zone. A sustained break above this region would be required to invalidate the current bearish structure and reopen a path toward 70,000–72,000 liquidity zones.
On the downside, initial support is located at 64,800, followed by a more significant liquidity cluster at 63,000. A breakdown below this zone exposes the psychological threshold at 60,000, which aligns with both structural support and projected pattern targets.
Order book data suggests increasing bid concentration below 63,500, indicating that liquidity is building in anticipation of potential downside testing rather than upside continuation.
Outlook: Event-Driven Breakout or Structural Breakdown
The BTC/USD pair remains in a technically fragile equilibrium defined by macro uncertainty, ETF-driven outflows, and bearish continuation structure formation. The compression into the 65K–66K range suggests that a volatility expansion phase is imminent, with direction likely determined by the FOMC policy tone and subsequent dollar liquidity expectations.
Unless BTC/USD reclaims and stabilizes above the 100-day EMA near 68,000, the dominant probability remains skewed toward a continuation of the corrective structure, with 60,000 acting as the primary downside magnet in the current cycle.