
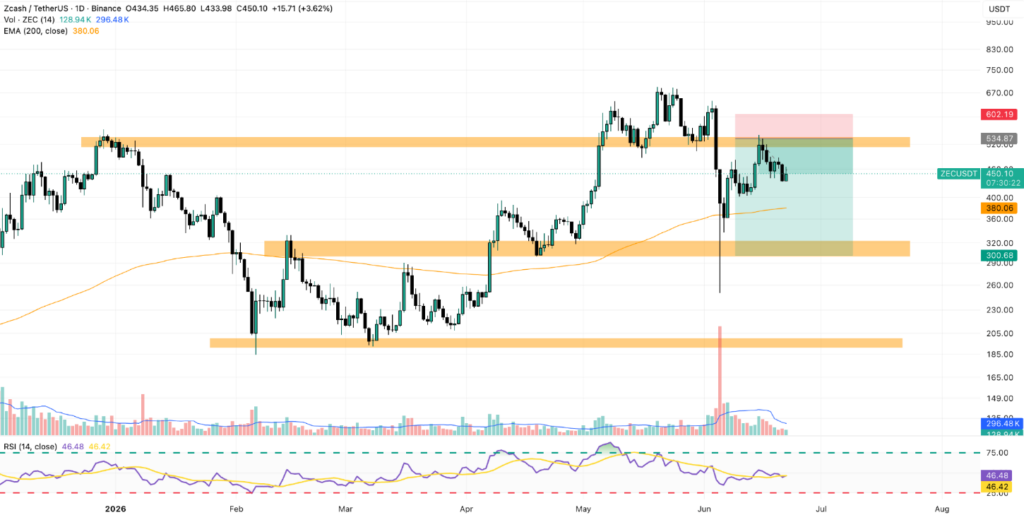
Zcash has transitioned into a clearly bearish market structure after rejecting a move above the $500 resistance level, followed by a 14% decline over 7 days. The rejection is technically significant because it occurred after a sharp expansion phase from the $250 accumulation zone, implying a complete cycle from accumulation to markup to distribution. Sollventis’s experienced brokers take a thorough look at this topic in the following article.
Price action shows multiple failed attempts to sustain levels above the $480–$500 zone, with each rejection producing lower highs. This establishes a short-term descending supply structure, where sellers consistently absorb liquidity on every rally.
The immediate downside reference remains the $300 demand zone, which previously acted as a high-volume reaction area during prior consolidation phases.
Macro Conditions: Liquidity Contraction and Rate Expectations
Macro liquidity conditions continue to deteriorate, reinforcing downside pressure across high-beta assets. Market-implied probability of a rate increase by approximately 50bps within the next policy window has risen near 70%, reflecting tighter financial conditions and reduced risk appetite.
From a quantitative liquidity perspective, higher rates increase the discount rate applied to speculative assets, reducing fair-value multiples for tokens with high volatility and uncertain cash-flow equivalents. This typically results in compressed valuation bands, lower breakout success rates, and stronger mean reversion.
For ZEC specifically, reduced liquidity depth amplifies downside volatility, especially when combined with weak technical positioning below recent highs.
Fundamental Risk Shock: Protocol Vulnerability and Trust Compression
A key structural variable affecting Zcash (ZEC) pricing is the recently disclosed protocol-level vulnerability reported by Zooko Wilcox. The exploit theoretically allowed unauthorized minting of ZEC without immediate detection, introducing a potential infinite-supply edge case risk.
Even though the issue was patched, the market impact is driven by probabilistic trust repricing, not confirmed exploitation. In crypto valuation models, perceived supply integrity risk leads to a measurable risk premium expansion, often reflected as higher volatility, lower multiple expansion capacity, and reduced institutional participation.
Secondary market reactions included reported liquidation behavior from large holders such as Arthur Hayes, reinforcing short-term sell-side dominance and accelerating downside momentum.
Technical Indicators: EMA Compression and Structural Weakness
ZEC remains above the 200-day exponential moving average (EMA), currently acting as a critical trend delimiter. However, price compression beneath the $420–$460 range suggests weakening bullish control.
The 200-day EMA slope is flattening, indicating a transition from a bullish trend regime to a neutral-to-distribution regime. Historically, when price repeatedly fails above prior cycle highs while EMA slope flattens, the probability of a breakdown increases significantly.
A decisive daily close below the 200-day EMA would trigger a structural shift into macro bearish confirmation, increasing the probability of a rapid extension toward the $300 liquidity zone.
Volume profile analysis shows declining buy-side participation above $450, while sell-side volume spikes during each retest of $500, confirming sell pressure absorption dominance.
Momentum Signals: RSI Neutral with Bearish Drift
The Relative Strength Index (RSI) on the daily timeframe is currently in the 45–50 range, indicating neutral momentum overall but with a slight downward bias beginning to form. This suggests neither strong bullish nor bearish control at the moment, though pressure is gradually tilting to the downside.
A break below the RSI 40 level would typically confirm a shift into a bear-dominated momentum regime. Such a move is often associated with stronger downside continuation, faster price declines, and weaker recovery attempts.
In addition, the presence of lower highs in RSI relative to price points toward a continuing bearish divergence. This reinforces the view that buying pressure is fading and demand is becoming less responsive to upward moves.
Price Zones and Liquidity Mapping: $300 Target Activation Risk
The key downside liquidity cluster remains centered at $300, which previously acted as a high-demand reaction zone with elevated historical volume.
Between the current price levels and $300, there is a visible low-volume gap region, meaning the price could move rapidly through this zone if the $420–$400 support fails. This type of structure increases the probability of air-pocket downside movement, where price declines occur with minimal intermediate consolidation.
Upside liquidity remains concentrated near $480–$500, but repeated rejections suggest this zone has transitioned from resistance to an active supply distribution band.
Structural Outlook: Bearish Continuation Bias Intact
The combination of macro liquidity contraction, protocol-level trust degradation, and technical rejection at $500 establishes a high-probability bearish continuation framework for Zcash.
As long as the price remains below $500 resistance and the 200-day EMA remains unbroken, the dominant probability scenario favors continued downside expansion toward $300, with potential interim volatility spikes driven by short-term mean reversion attempts.
If the 200-day EMA fails, the market would likely enter a full trend breakdown phase, accelerating downside velocity and confirming a broader cycle transition from range expansion to distribution unwind.