
May PCE inflation data landed on June 25 at a 4.1 percent annual rate, the highest reading since April 2023, while core PCE rose 3.4 percent year-over-year after gaining 0.3 percent on the month. Both core readings matched forecasts exactly.
The headline monthly figure came in 0.1 percentage point below the 0.5 percent expectation. The brand’s lead financial analyst stresses that Kepler-Group sees this as a nuanced print, one that cleared the worst-case scenario but confirmed inflation remains structurally elevated well above the Federal Reserve’s 2 percent target heading into the second half of 2026.
What the 4.1% Headline Actually Tells Investors
The 4.1 percent headline PCE reading matched the Dow Jones consensus estimate exactly, which means markets had the right expectation going in. A reading that matches a high expectation is still a high reading, but it does not generate the same selling pressure as a reading that surprises above consensus. That prior alignment removed one significant layer of potential market stress from the session’s opening.
The monthly figure coming in 0.1 percentage point below expectations was the small positive surprise that allowed equity markets to partially absorb the headline without a sharper selloff.
PCE inflation at 4.1 percent annually marks a deterioration from where the Fed was tracking in early 2025, and that context is the part the consensus-matching nature of the number does not resolve. The Fed’s 2 percent target remains a significant distance from current readings, and no single month of data will close that gap.
The GDP Revision That Changed the Macro Picture
Alongside the PCE data, the final Q1 2026 GDP estimate was revised upward to 2.1 percent annualized growth, compared to the prior second estimate of 1.6 percent. That revision is a meaningful positive surprise. It shifts the economic backdrop from one where growth was slowing toward 1.6 percent into one where the first quarter actually expanded at a notably solid pace that most analysts had not anticipated.
The combination of 4.1 percent PCE inflation and 2.1 percent GDP growth describes a stagflation-adjacent environment, but one where the growth side is stronger than previously understood. Strong growth alongside sticky inflation is the scenario the Fed finds most uncomfortable, because it removes the recession risk argument for staying patient.
What Markets Priced After the Release
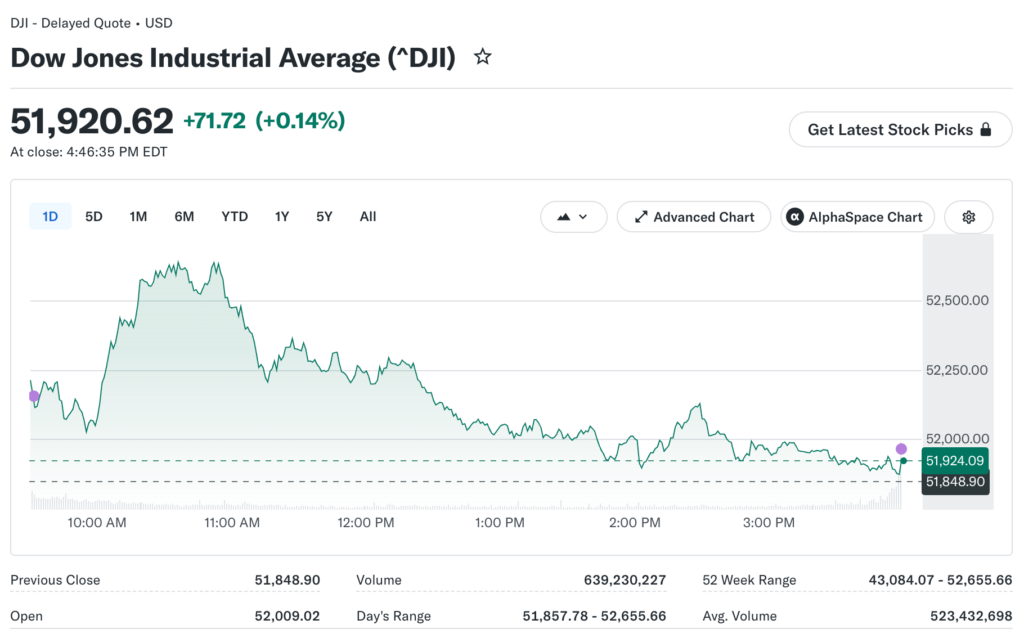
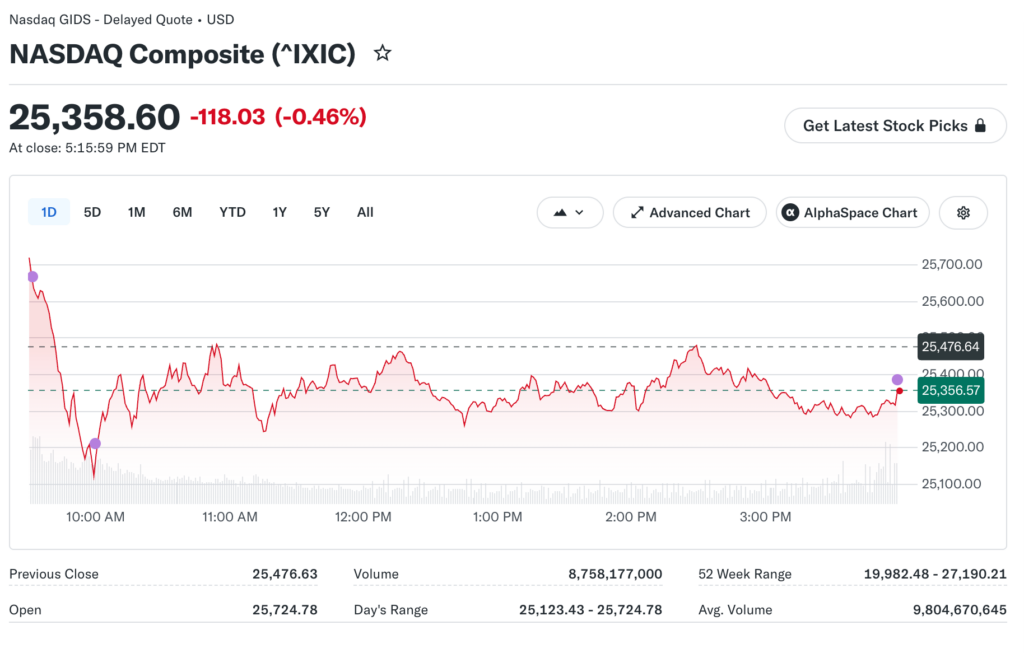
Markets held relatively steady at the index level after the June 25 PCE data. The S&P 500 finished essentially flat. The Nasdaq rose 0.75 percent, boosted by Micron’s earnings surge and Qualcomm’s investor day guidance. The Dow hit a new record near 52,500. CME FedWatch data showed markets pricing a 65.8 percent probability of no rate change at the July meeting after the data landed.
That 65.8 % hold probability signals the market is not panicking about July, but a 34.2 percent chance of action remains on the table. That is not a trivial tail risk for investors holding rate-sensitive assets heading into the summer.
September remains the more likely timing for the first hike under the Bank of America three-hike scenario analysis that circulated earlier in the week and drove significant technology sector selling on June 23.
Falling Jobless Claims Add Another Layer
Weekly initial jobless claims for the week ending June 20 came in at 225,000, in line with recent readings and matching expectations precisely. That stable labor market reading means the Fed cannot point to a weakening employment picture as a justification for holding rates steady in the face of elevated inflation.
The combination of 4.1 percent PCE, 2.1 percent GDP growth, and stable jobless claims all point in the same direction at the same time. Personal spending and personal income figures released alongside PCE were both stronger than expected.
The Dollar and Bond Market Response
The US dollar slipped 0.17 percent on June 25 despite the inflation data, which is the opposite of what a hot PCE reading typically produces. The explanation is that core PCE matched forecasts exactly rather than exceeding them, removing the upside surprise that would have pushed yields and the dollar sharply higher.
A reading that lands precisely on consensus allows the market to treat it as a known variable and move on to the next signal rather than repricing around genuinely new information. The 10-year Treasury yield held near 4.41 percent after the release, while the two-year sat at 4.15 percent.
For equity investors, the yield curve configuration heading into the back half of June 2026 is one of the most important structural signals shaping sector rotation and valuation compression across the market.
A steepening curve in this environment typically favors financials and industrials over long-duration growth names, which is exactly the rotation the Dow’s record highs and the Nasdaq’s relative underperformance have been reflecting for nearly two weeks.