
West Texas Intermediate (WTI) retreats from its recent one-month high of 99.25-99.30, slipping below $97.50 during the Asian session and interrupting a seven-session winning streak.
The pullback reflects short-term profit-taking and improving expectations for crude oil supply following a decision to waive most sanctions and tariffs affecting Russian trade.
The article provides an in-depth analysis of this subject, presented by Vaulltier’s brokers.
Despite the correction, the broader bullish price structure remains intact. Persistent geopolitical risks, particularly around the Strait of Hormuz, continue to underpin the crude oil market and limit the potential for an aggressive downside extension.
Over the weekend, three tankers were damaged in the Strait of Hormuz, while restrictions imposed by Iran’s Islamic Revolutionary Guard Corps increased concerns about shipping disruptions.
Additional threats of military retaliation, Ukrainian drone attacks on Russian energy infrastructure, and continuing hostilities involving Saudi Arabia and Houthi forces in Yemen sustain the geopolitical risk premium.
These developments create opposing fundamental forces. Potentially higher Russian supply represents a bearish catalyst, whereas transportation disruptions and infrastructure risks provide bullish support. The next directional move will depend on whether supply optimism outweighs geopolitical risks or renewed buying absorbs the latest selling pressure.
WTI Technical Analysis: Bullish Momentum Persists
On the four-hour chart, WTI retains a constructive technical configuration, trading above the 100-period simple moving average (SMA) and maintaining its position relative to the referenced Fibonacci retracement levels.
The Relative Strength Index (RSI) near 63 indicates positive momentum, with the indicator remaining above the neutral 50 threshold. Although the recent rally increased the risk of overextension, the latest pullback may represent momentum normalization rather than a confirmed bearish reversal.
The Moving Average Convergence Divergence (MACD) remains marginally positive, suggesting that the underlying bullish impulse has not yet been invalidated. The modestly positive reading suggests traders should monitor whether bullish momentum strengthens or weakens during consolidation.
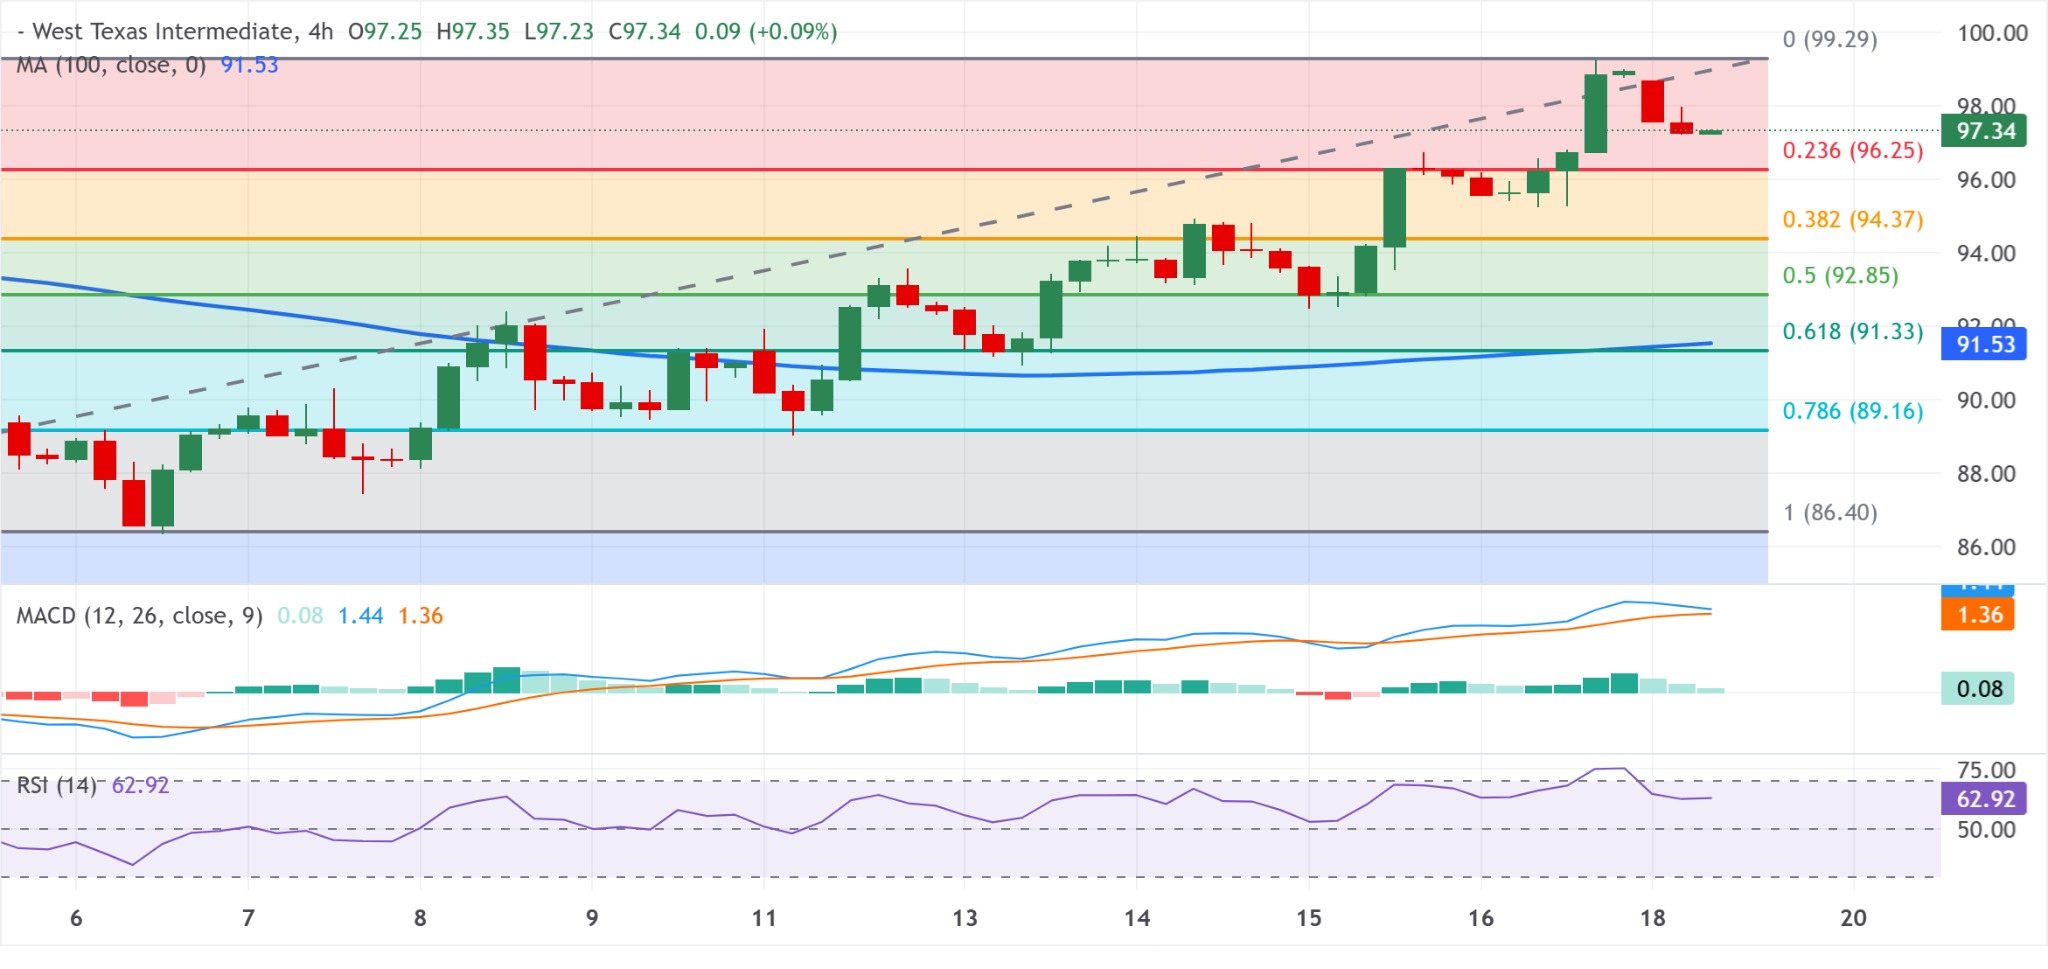
The combination of RSI above 50, a positive MACD, and price holding above the 100-period SMA supports a continuation bias. Confirmation would require renewed upward momentum and a decisive break above the recent swing high.
Weakening momentum accompanied by a sustained break below initial Fibonacci support would increase the probability of a deeper retracement.
Key Fibonacci Support Levels and Downside Targets
The $96.25 level, corresponding to the 23.6% Fibonacci retracement, represents the first significant downside reference. A successful defense of this area could attract dip-buyers and establish a higher low within the existing bullish structure.
A decisive four-hour close below $96.25 would weaken the immediate bullish setup and expose the 38.2% retracement at $94.37. This level represents the next technical support and a potential area for buyers to reassess market positioning.
Further selling would bring the 50% retracement at $92.85 into focus. A decline toward this level would indicate a more substantial correction from the recent advance, although the broader trend would require additional confirmation before being classified as bearish.
The 61.8% Fibonacci retracement near $91.33 represents a deeper structural support zone. The 100-period SMA also contributes to the broader technical assessment, with its precise alignment requiring monitoring as new four-hour candles develop.
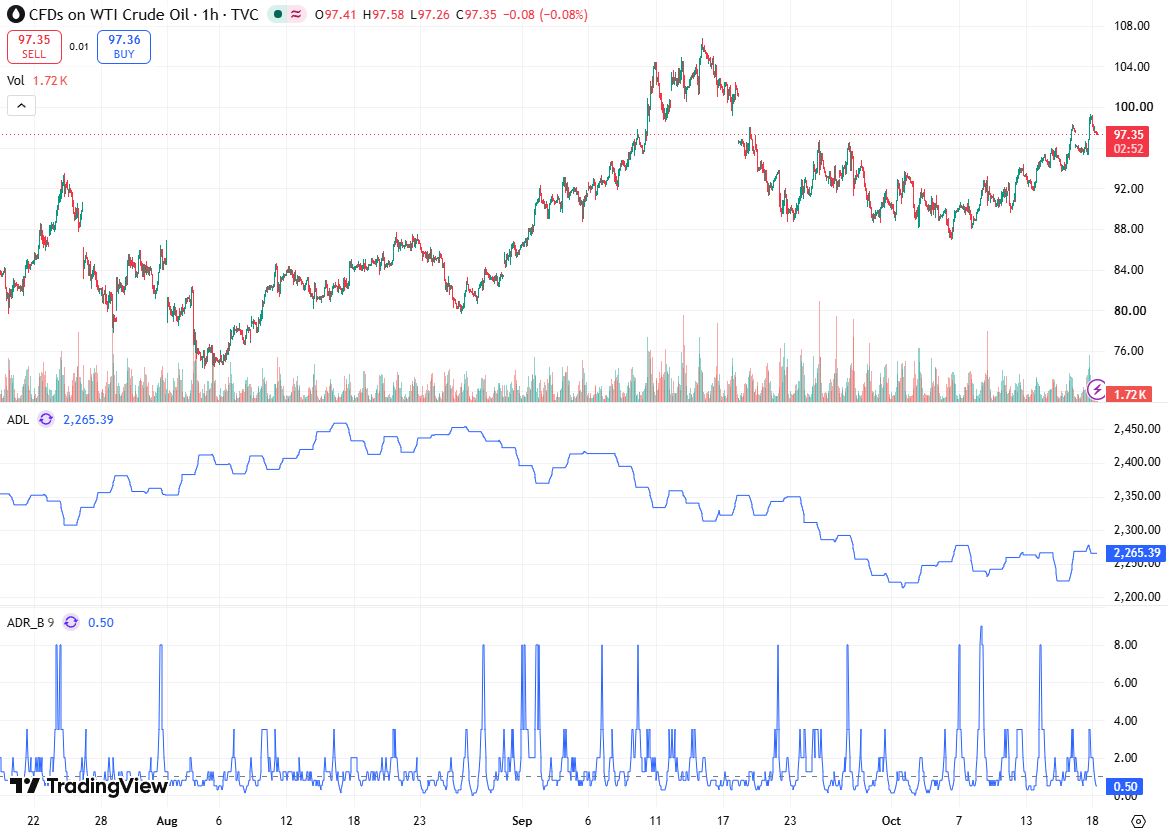
The progression through these levels provides a measurable framework for evaluating downside momentum. Holding above $96.25 favors a corrective pullback, while sustained trading below $94.37 would indicate increasing bearish pressure.
Resistance at $99.29 and Bullish Breakout Potential
On the upside, 99.25-99.30 defines the immediate resistance zone and recent swing-high boundary. A sustained breakout above $99.29 would confirm renewed buying pressure and signal a potential continuation of the prevailing upward trend.
A convincing breakout should ideally coincide with strengthening RSI momentum, an improving MACD configuration, and sustained price acceptance above resistance. Without these confirmations, a brief move above the swing high could prove vulnerable to a false breakout and renewed profit-taking.
If resistance remains intact, WTI may continue consolidating between $96.25 and $99.29, creating a short-term range of approximately $3.04 per barrel. A break below the range would shift attention toward $94.37, whereas an upside breakout would reinforce the bullish continuation scenario.
WTI Price Forecast and Conclusion
WTI remains technically bullish despite retreating below $97.50 after reaching a one-month high. The RSI near 63, marginally positive MACD, and position above the 100-period SMA favor further upside potential, although short-term profit-taking and supply expectations may prolong consolidation.
The $96.25 support level is the immediate downside threshold, followed by $94.37, $92.85, and $91.33. On the upside, a sustained break above $99.29 would strengthen the continuation outlook.
Until either boundary is decisively breached, the most defensible assessment is bullish consolidation within an established uptrend, with geopolitical developments remaining a key volatility driver.