

Silver (XAG/USD) extends its corrective decline during the Asian session, falling below $57.50 after retreating from the weekly high near $58.60. The pullback increases short-term selling pressure, although the broader technical structure remains range-bound rather than decisively bearish.
With prices holding above support near $56.80, a confirmed breakdown remains necessary to validate further losses. Aurelgate’s experts offer valuable expertise and a detailed examination of the subject.
The rejection from $58.60 indicates persistent selling interest near the upper boundary of the trading range. The decline below $57.50 brings silver closer to the range midpoint and increases the likelihood of another support test. Still, the absence of a sustained close below $56.80 limits confirmation of bearish continuation.
Silver also remains above its recent three-month low, suggesting that the latest decline has not established a fresh downward leg. The immediate outlook depends on whether sellers can break support or buyers can defend the existing consolidation structure.
US Dollar Strength and Interest-Rate Expectations
The US Dollar Index (DXY) remains supported above its recent nearly three-week low, creating headwinds for dollar-denominated silver. Elevated energy-driven inflation risks continue to influence Federal Reserve policy expectations, keeping the possibility of further monetary tightening under consideration.
Higher interest-rate expectations can pressure non-yielding precious metals by increasing the relative attractiveness of interest-bearing assets. A stronger dollar also reduces purchasing power for overseas buyers, potentially limiting demand for XAG/USD.
MACD, RSI, and Moving-Average Resistance
The four-hour chart presents mixed momentum signals. The Moving Average Convergence Divergence (MACD) indicator has turned modestly positive, suggesting that bearish momentum may be weakening following the rejection near $58.60. This development supports a consolidation scenario but does not independently confirm a bullish reversal.
The Relative Strength Index (RSI) stands near 48, close to its neutral threshold of 50. This reading indicates a slight bearish bias without extreme selling conditions.
A move above 50 would signal improving upside momentum, while a decline toward 40 would suggest strengthening downside pressure. A reading near 30 would indicate traditionally oversold conditions.
The 100-period Simple Moving Average (SMA) on the four-hour chart, near $59.51, remains the principal overhead resistance barrier. Trading beneath this average indicates that the short-term structure has yet to turn decisively bullish.
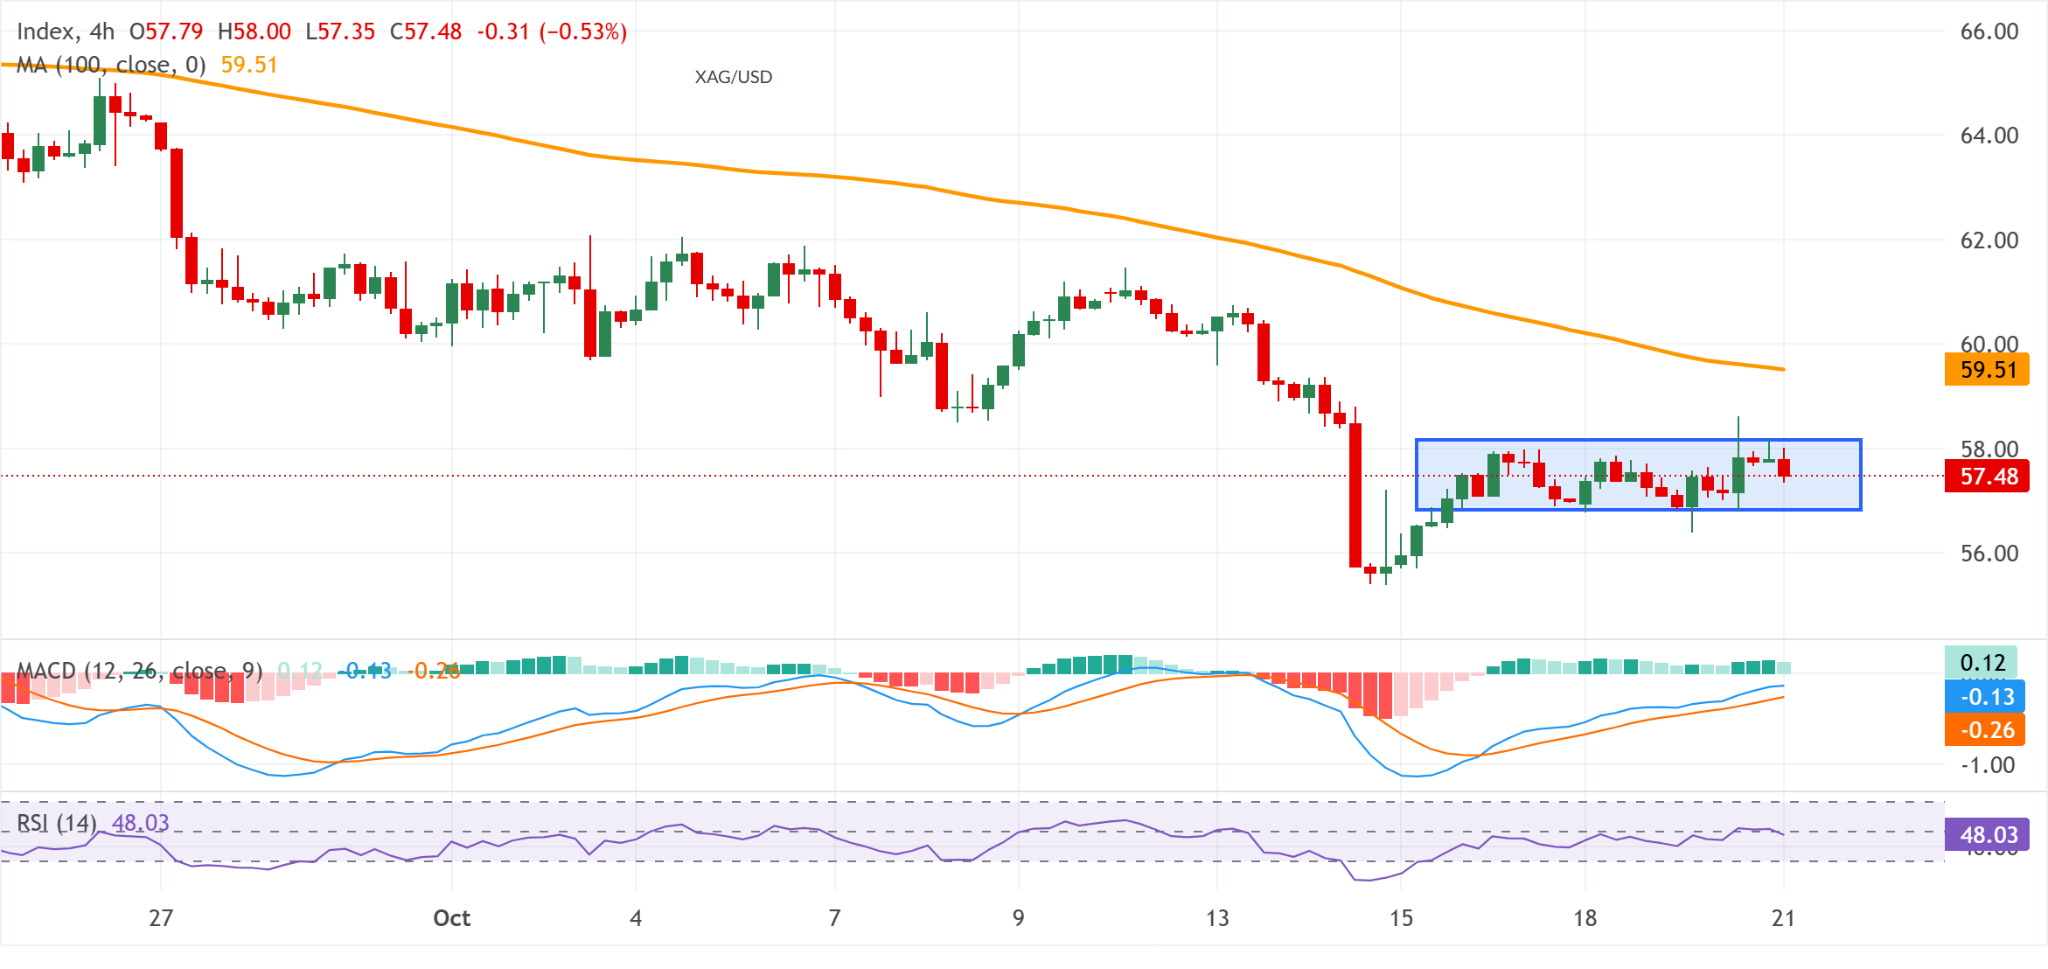
A stronger recovery would require the RSI to reclaim 50, MACD momentum to improve, and price to break successive resistance levels. Until these conditions align, momentum stabilization does not constitute a confirmed trend reversal.
$56.80 Support: The Critical Breakdown Threshold
The primary downside trigger remains $56.80, marking the lower boundary of the prevailing trading range. A decisive four-hour close below this level, followed by an unsuccessful retest, would strengthen the case for a bearish range breakdown.
Such a move could expose the $56.50 region, with the 57.00–56.50 area representing a potential zone for short-term price reactions rather than established support. Accelerating selling and expanding volatility could increase the risk of further losses.
The quality of the breakdown is critical. A brief intraday move below $56.80, followed by a rapid recovery, would raise the risk of a false downside breakout. Sustained trading beneath support would provide stronger confirmation that sellers have regained control.
If $56.80 holds, silver could remain within its existing range, allowing buying interest to emerge and prices to recover toward the upper boundary.
$58.20 Resistance and the Path Toward $59.51
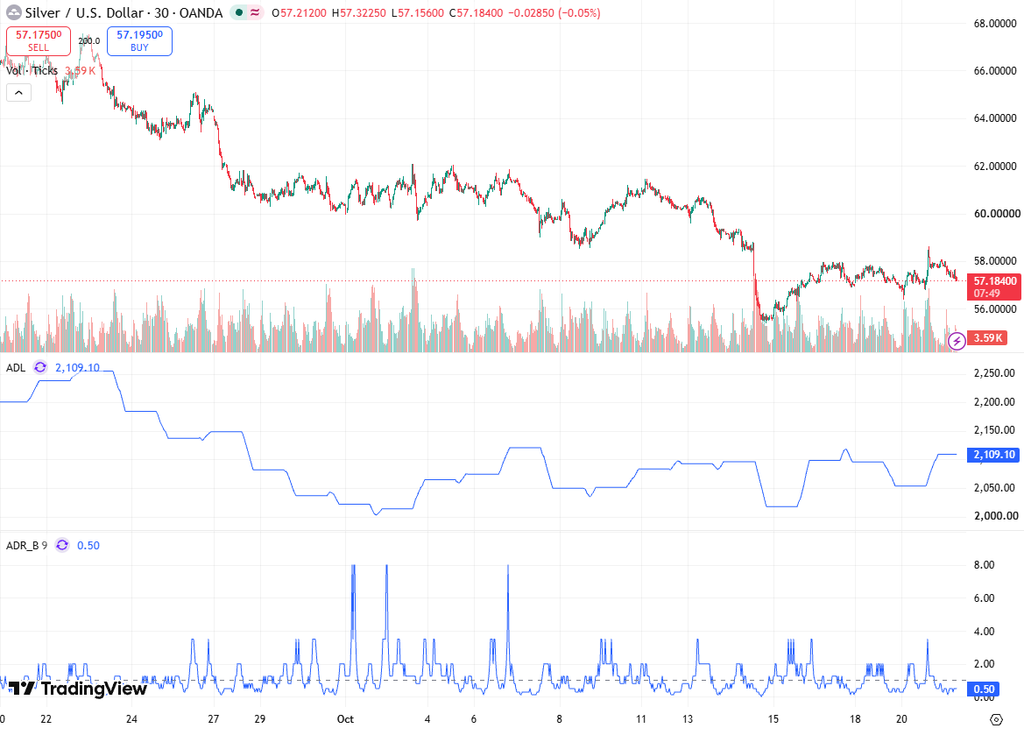
On the upside, initial resistance lies around 58.00–58.20. A sustained break above $58.20 would improve the short-term technical outlook and bring the previous swing high near $58.60 into focus.
A breakout above $58.60 could open the way toward the psychological $59.00 level. Beyond this threshold, the 100-period SMA near $59.51 represents the next major technical obstacle.
A sustained four-hour close above $59.51 would weaken the prevailing bearish bias and strengthen the case for a broader recovery. Rejection at this moving average would preserve downside risks and potentially return silver toward the range midpoint.
The distinction between an intraday spike and sustained acceptance above resistance remains essential. Without confirmation, rallies may represent corrective rebounds within the broader consolidation structure.
Conclusion: Range Support Determines the Next Direction
The XAG/USD outlook remains cautiously bearish below $58.60, as the decline beneath $57.50 reflects persistent selling pressure. The $56.80 support level is the decisive downside threshold, with a confirmed breakdown potentially exposing $56.50.
On the upside, $58.20, $58.60, and $59.00 represent successive resistance levels, while the $59.51 four-hour SMA remains the principal barrier to a bullish reversal. With the RSI near 48 and the MACD modestly positive, momentum signals remain mixed.
A confirmed breakout from the trading range will determine whether silver extends its decline or stages a technical recovery.