

The USD/CAD pair remains vulnerable to further downside, with spot prices near 1.4050 after failing to extend the previous session’s rebound from 1.4030, a nearly one-month low. Gain a deeper understanding of the subject through Aurelgate’s brokers’ expertise.
Rising crude oil prices support the Canadian Dollar (CAD), while a modest recovery in the US Dollar (USD) limits immediate selling pressure. The technical structure favors sellers, although a decisive break below the 50% Fibonacci retracement at 1.4030 is needed to confirm bearish continuation.
The Canadian Dollar’s sensitivity to energy markets is a key driver of price action. As a major crude oil exporter, Canada benefits from stronger energy prices through improved export revenues and potentially greater currency demand.
Sustained crude oil gains are reinforcing downside pressure on USD/CAD, particularly while the pair remains below short-term moving-average resistance.
The US Dollar draws support from expectations of further monetary tightening, with markets pricing in approximately a 90% probability of a Federal Reserve rate increase in December, according to the supplied market assessment.
Monetary Policy Divergence and Market Volatility
The forthcoming Bank of Canada (BoC) policy decision and Federal Open Market Committee (FOMC) meeting represent important catalysts. Changes in policy guidance, inflation projections, and interest-rate expectations could alter the relative attractiveness of Canadian- and US-dollar-denominated assets.
A more hawkish Federal Reserve outlook could support USD/CAD through higher US yields, while a comparatively hawkish Bank of Canada stance could strengthen the Canadian Dollar. Crude oil prices, bond-yield differentials, and central bank guidance will remain critical in determining whether the pair breaks support or stages a corrective rebound.
Technical Analysis: 1.4030 Is the Critical Bearish Trigger
On the four-hour chart, USD/CAD retains a bearish near-term bias, with price action struggling to establish sustained upward momentum. The primary threshold is 1.4030, corresponding to the 50% Fibonacci retracement of the September–October advance.
This level marks the midpoint of the preceding rally and provides an important reference for measuring the current correction.
A decisive four-hour close below 1.4030 would strengthen the case for bearish continuation. Such a breakdown would indicate weakening demand around the 50% retracement, potentially exposing deeper support. Stronger downside momentum and continued trading below short-term moving averages would reinforce the signal.
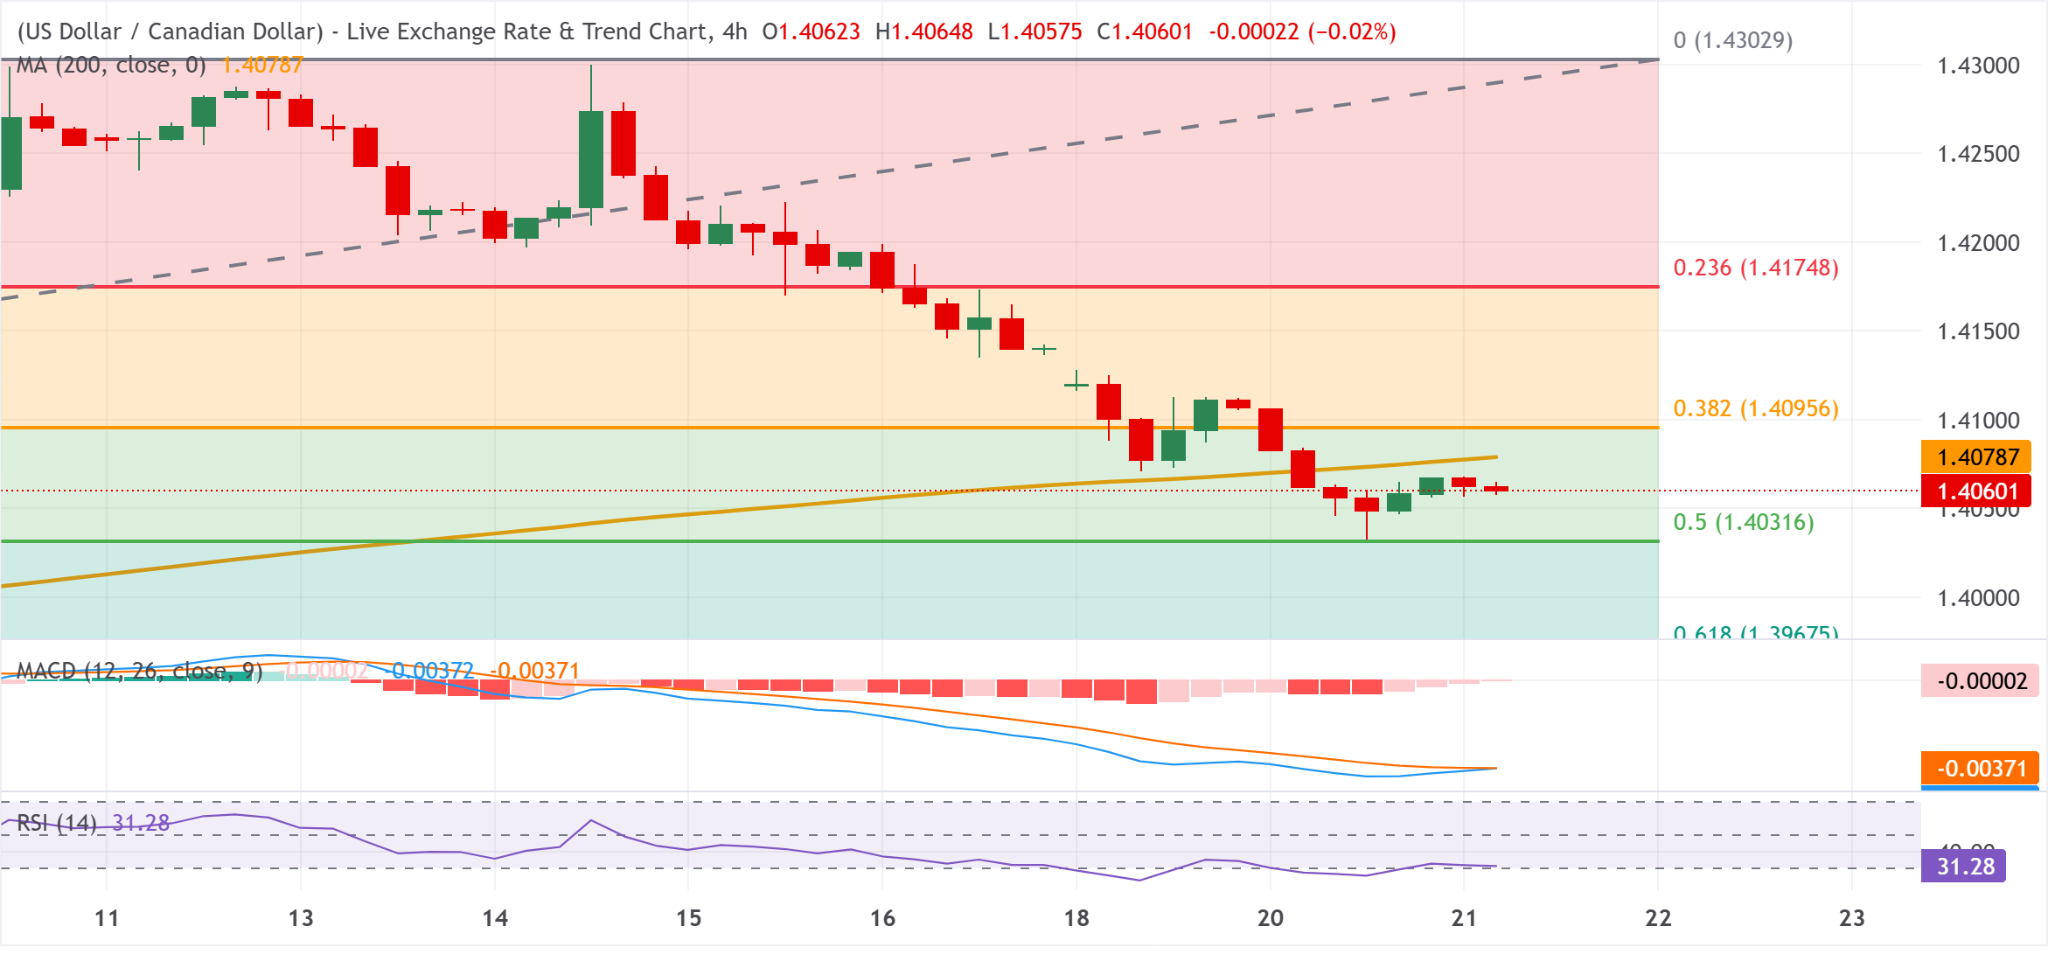
The Relative Strength Index (RSI) is hovering near 31, approaching the conventional oversold threshold of 30. This reading indicates substantial selling pressure, although it also raises the possibility of short-covering or a temporary rebound. A recovery above 30, accompanied by improving momentum, could indicate stabilization.
Meanwhile, the Moving Average Convergence Divergence (MACD) remains slightly below its zero line, indicating that bearish momentum dominates the short-term trend. A deeper negative reading would support further declines, while an upward crossover alongside improving price action could signal diminishing selling pressure.
Downside Targets: 1.3968, 1.3876, and 1.3760
Following a confirmed break below 1.4030, the immediate downside objective is the 61.8% Fibonacci retracement at 1.3968. The approximately 62-pip decline from 1.4030 to 1.3968 would mark the next corrective leg, with this retracement potentially attracting renewed buying interest.
A sustained break below 1.3968 would shift attention toward 1.3876, followed by the broader support zone near 1.3760. The latter represents a deeper retracement and could help determine whether the decline remains a correction of the previous advance or develops into a broader bearish reversal.
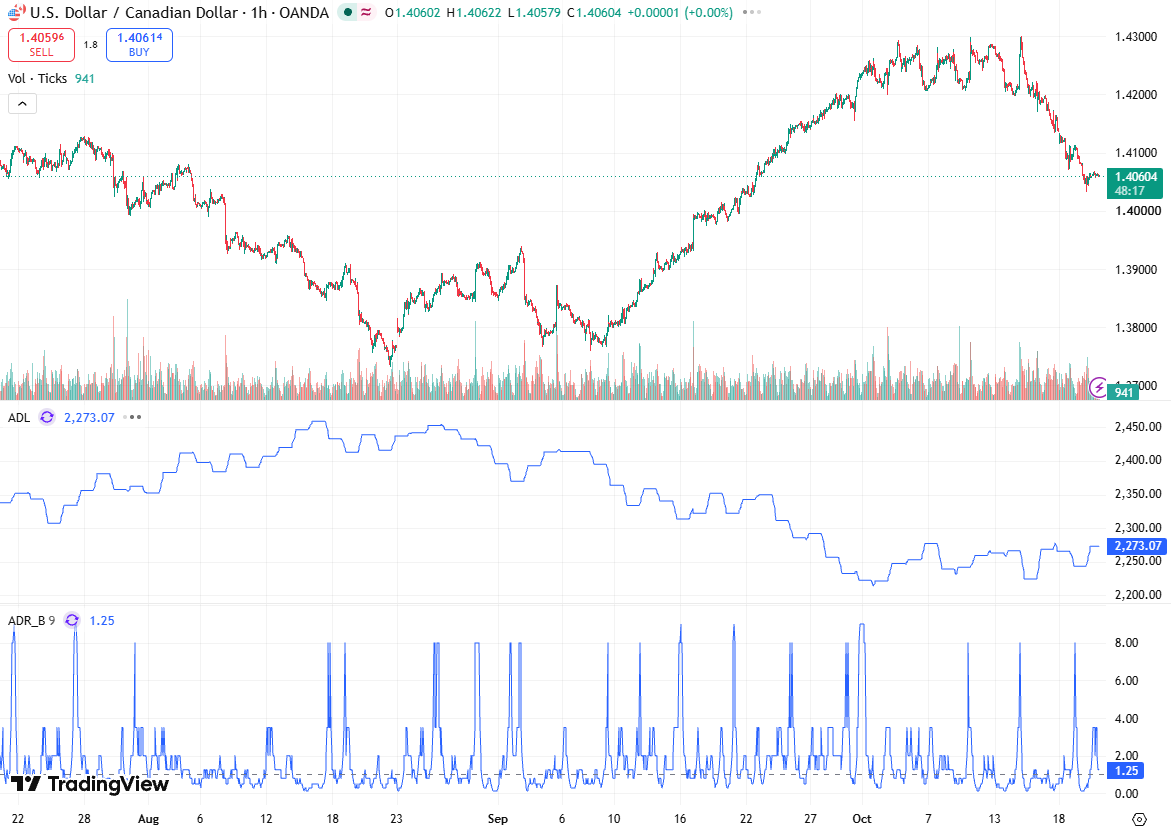
Sustained trading below successive support levels would strengthen the downside structure. Failure to hold below these thresholds could trigger short-covering rallies and renewed tests of broken support.
Resistance Levels: 1.4079–1.4096 and 1.4175
Initial upside resistance lies between 1.4079 and 1.4096, where the 200-period simple moving average (SMA) converges with the 38.2% Fibonacci retracement. This 17-pip resistance band represents the first major obstacle for bullish recovery attempts.
A rejection from this zone would reinforce the bearish setup and leave 1.4030 vulnerable to another test. A sustained four-hour close above 1.4096 would ease immediate selling pressure and expose the 23.6% Fibonacci retracement at 1.4175. Beyond that level, the recent swing high near 1.4303 would become the next major upside reference.
Conclusion: Bearish Confirmation Depends on 1.4030
The USD/CAD outlook remains bearish, supported by crude oil strength, an RSI near 31, and a negative MACD reading. The immediate priority for sellers is a confirmed break below the 50% Fibonacci retracement at 1.4030.
A sustained breakdown would expose 1.3968, followed by 1.3876 and 1.3760. On the upside, 1.4079–1.4096 remains the key resistance zone, with 1.4175 the next recovery target if it is breached.
Until support breaks decisively, the bearish scenario remains conditional, as Federal Reserve expectations, geopolitical risks, and central bank guidance could trigger sharp countertrend movements.