
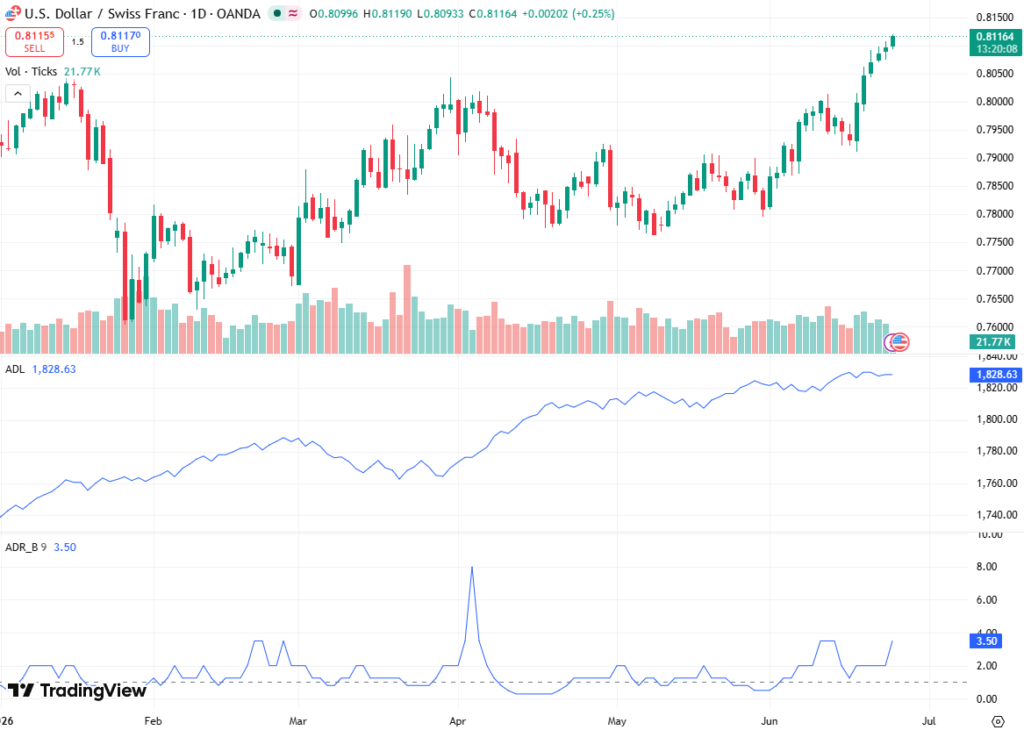
The USD/CHF pair is extending its bullish trajectory, trading around 0.8125, marking a seven-month high and confirming a sustained uptrend structure on both intraday and daily timeframes.
Price action has now registered six consecutive bullish sessions, with a cumulative advance of approximately +1.6% from the recent swing low near 0.8000. Rubinax’s brokers provide an in-depth exploration of this topic in the article below.
The pair has decisively broken above the 0.8100 structural resistance, a level that previously acted as a multi-week supply zone. This breakout has shifted the market into a new price discovery phase, with the nearest liquidity cluster concentrated between 0.8124 and 0.8132, corresponding to prior 2025 swing highs.
Macro Flow Drivers and Risk Transmission
The ongoing appreciation in USD/CHF is being driven primarily by a shift in global risk sentiment, with capital flowing toward the US dollar as the dominant safe-haven asset. A recent 3.2% correction in global technology indices has intensified risk-off positioning, boosting demand for USD liquidity across FX markets.
At the same time, geopolitical uncertainty has increased volatility expectations, with markets pricing a higher risk of disruptions to energy transport routes, particularly around the Strait of Hormuz, which handles roughly 20% of global oil transit flows. This has raised implied risk premiums and indirectly supported the dollar through deleveraging in risk-sensitive currencies.
The Swiss franc (CHF), despite its traditional safe-haven status, is underperforming due to relative interest rate differentials. The US yield advantage remains positive by around 150–175 basis points across short-term maturities, continuing to limit CHF inflows versus USD allocations.
Liquidity Zones and Market Microstructure
Order flow analysis suggests liquidity above 0.8120 has been steadily absorbed, with buy-side imbalance driving price toward the 0.8130 liquidity pocket. This zone aligns with prior rejection areas from Q3 and Q4 2025, making it a notable supply region.
Above current levels, the next liquidity pool sits at 0.8150, corresponding to the 161.8% Fibonacci extension of the previous corrective move from 0.7985 to 0.8075. Extension levels like this are often associated with exhaustion zones where algorithmic profit-taking tends to increase.
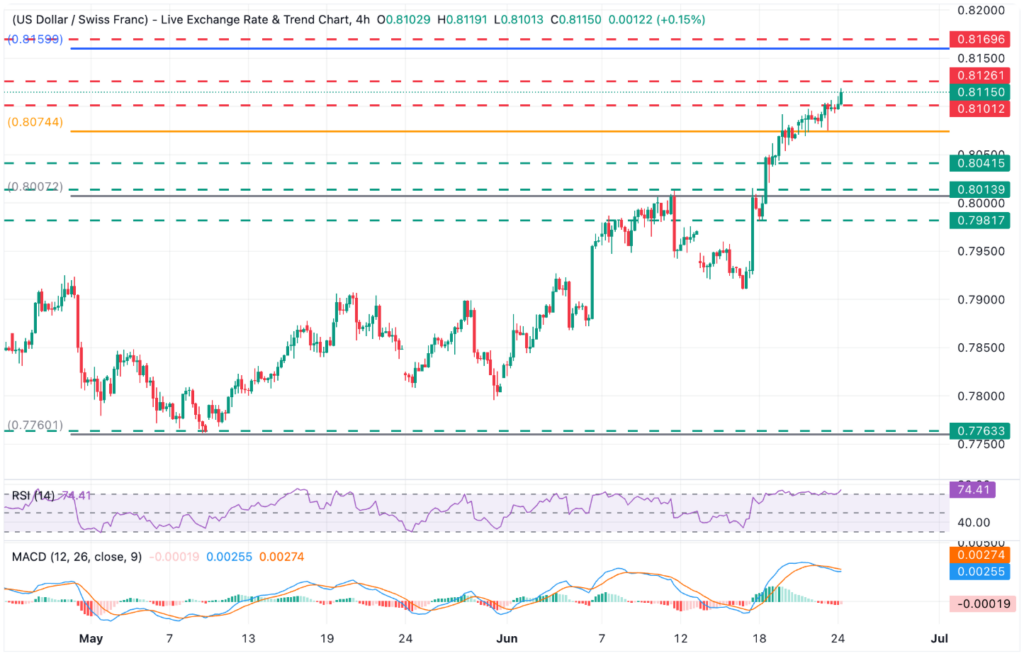
A sustained move beyond 0.8150 would expose the 0.8170–0.8180 range, which represents a broader structural ceiling shaped by multi-month distribution activity.
Momentum Indicators and Trend Validation
Despite the strong directional bias, momentum indicators suggest a mature bullish phase. The 4-hour RSI is currently near 74–76, firmly in overbought territory above the 70 level. Historically, sustained readings above 72 in USD/CHF have often preceded either short-term mean reversion of around 0.4–0.8% or sideways consolidation lasting roughly 12–36 trading hours.
The MACD histogram is also compressing, showing fading upside momentum despite continued price highs. This divergence points to slowing bullish velocity, a typical characteristic of late-stage impulsive moves.
However, the broader uptrend remains intact as long as price holds above 0.8040, a key structural support that aligns with the previous breakout retest zone and the 38.2% Fibonacci retracement of the latest upward leg.
Key Resistance and Breakout Conditions
Immediate resistance is concentrated between 0.8124 and 0.8132, a zone defined by prior rejection highs and clustered liquidity. A sustained close above 0.8132 on a 4-hour and daily basis would confirm continuation of the bullish expansion phase.
Above this threshold, price acceleration toward 0.8150 becomes statistically probable, with extension probability increasing significantly if volatility expands above 6.5% annualized intraday variance.
The broader upside target remains positioned at 0.8170, where historical supply concentration and long-term profit-taking pressure converge.
Support Structure and Downside Contingencies
Initial support is located at 0.8085, representing intraday VWAP convergence and short-term order block support. A break below this level would signal early distribution and increase the probability of a retracement toward 0.8040.
The 0.8040 zone remains the critical structural pivot, aligning with prior breakout confirmation levels and the 50% Fibonacci retracement of the latest impulse leg. A sustained breakdown below this level would shift short-term bias into a neutral-to-bearish corrective regime, exposing 0.8000 psychological support.
Below 0.8000, liquidity thinning increases downside velocity risk toward 0.7960, although current macro conditions do not strongly support such a reversal scenario.
Conclusion: Trend Extension Near Resistance Cluster
The USD/CHF structure remains strongly bullish, supported by sustained USD demand, widening rate differentials, and persistent risk-off flows. However, the pair is approaching a technically significant resistance band at 0.8130–0.8150, where historical supply and overbought momentum conditions converge.
As long as the price remains above 0.8040, the dominant bias remains upward continuation, with breakout potential toward 0.8170. Short-term conditions, however, increasingly favor controlled consolidation within a high-volatility bullish regime rather than uninterrupted acceleration.