
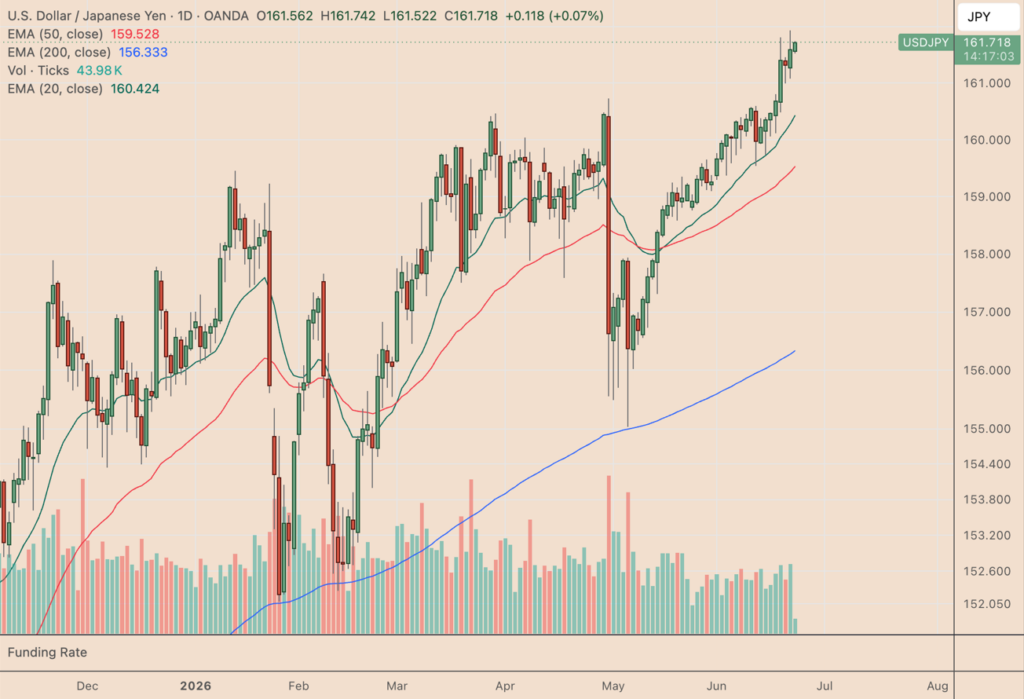
Bitcoin is entering a structurally sensitive phase as global liquidity conditions tighten through FX volatility, with particular focus on USD/JPY trading near 161–162. This zone is statistically significant because prior tests of similar levels preceded a multi-asset deleveraging shock in August 2024, when cross-market correlations abruptly converged toward risk-off liquidation. This article presents an in-depth analysis of the topic from Sollventis’s expert brokerage team.
The current macro setup is defined by elevated currency carry exposure, where leveraged capital is funded in low-yield yen liabilities and deployed into higher-beta assets. When USD/JPY rises steadily, carry positions remain stable. However, when volatility increases and the yen strengthens rapidly, mark-to-market losses on FX hedges force balance sheet contraction across leveraged portfolios.
The key systemic risk is not direction but the velocity of yen appreciation, which determines whether liquidation is orderly or forced.
Carry Trade Mechanics and Liquidity Transmission
The yen carry trade functions as a leveraged liquidity amplifier. Funding in yen at near-zero rates allows exposure to dollar-denominated assets with embedded leverage ratios often exceeding 3x to 8x, depending on institutional structure.
When the yen strengthens sharply, two simultaneous effects occur. First, FX liability expansion increases in real terms, raising margin requirements. Second, cross-asset correlation spikes as institutions rebalance risk simultaneously across equities, credit, and digital assets.
In August 2024, this mechanism triggered a synchronized drawdown:
Nikkei 225 experienced an intraday drawdown exceeding 12%, marking its most volatile session since 1987. At the same time, the S&P 500 declined by over 5%, while Bitcoin fell approximately 15% within a compressed liquidity window.
The Bank for International Settlements later estimated leveraged FX-related exposures, including carry structures, at approximately ¥40 trillion (~$250 billion), although true gross notional exposure is likely higher due to rehypothecation and shadow leverage.
Current Market Structure: Bitcoin Trend Decomposition
Bitcoin is currently exhibiting a bearish continuation structure characterized by a failed recovery leg and breakdown from a rising consolidation channel.
Price action shows BTC rejecting the $66,000 supply zone and failing to sustain momentum above intermediate resistance at $63,000, which now functions as a structural breakdown trigger. The loss of this level confirms a bear flag continuation pattern, where the preceding impulsive selloff is statistically projected to resume after a weak retracement.
Current trading near $62,000–$63,000 places BTC below all major trend anchors:
The 20-day exponential moving average is positioned near $65,000, the 50-day EMA near $68,800, and the 200-day EMA near $77,500. This configuration represents a fully inverted moving average stack, where short-term trend, medium-term trend, and macro trend are all aligned downward.
Such alignment typically reflects a multi-timeframe liquidity contraction phase, where rallies are sold into systematically rather than driven by spot accumulation.
Momentum Structure and Volatility Compression
The Relative Strength Index is currently near 38, indicating weakening bullish momentum without entering deeply oversold territory below 30. Historically, BTC trend accelerations in macro-driven selloffs tend to occur when RSI transitions from the 35–40 band into sub-30 conditions, often coinciding with forced liquidation cascades.
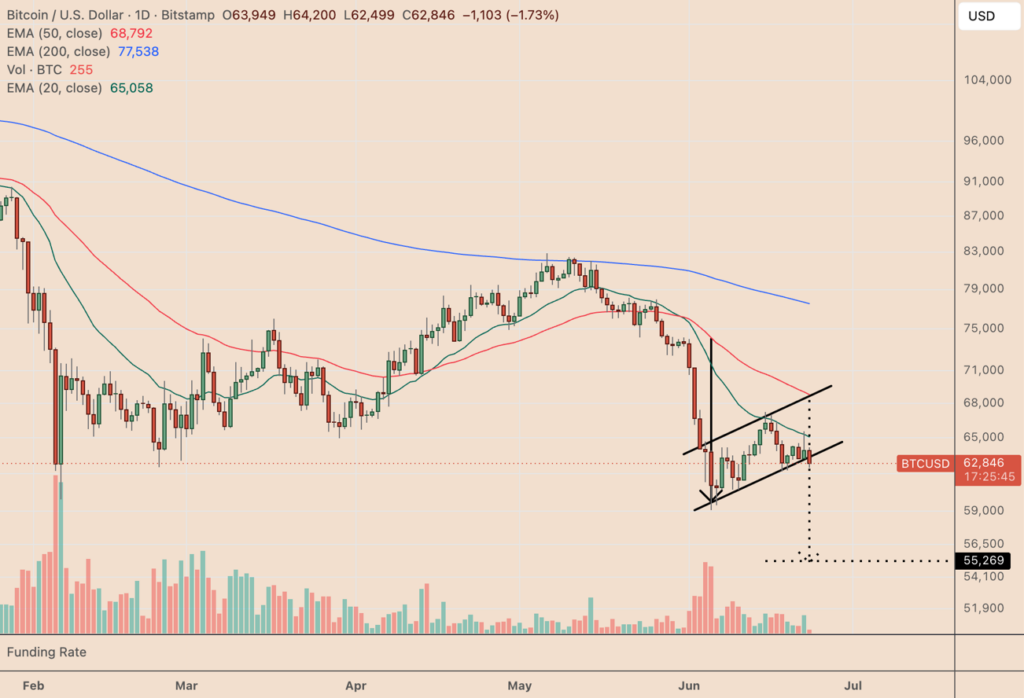
Volatility compression within the flag structure suggests energy accumulation for directional expansion. Measured move projections from the breakdown leg imply a downside extension equal to the prior impulse range of roughly $8,000–$9,000, projecting a technical target zone at $55,000–$55,300.
This projection aligns with historical liquidity gaps observed below the $60,000 psychological level, where order book depth thins significantly and slippage risk increases during forced selling events.
Critical Levels and Liquidi.ty Thresholds
Immediate downside liquidity is concentrated in the $60,000–$59,000 region, which represents a high-volume historical node. A decisive daily close below this band would likely trigger systematic liquidation algorithms and volatility expansion toward lower structural support.
Below $59,000, the next liquidity vacuum extends toward the $55,000 zone, which aligns with the bear flag measured move and prior accumulation inefficiency zones.
On the upside, structural invalidation requires a reclaim of the broken channel support, followed by stabilization above the 20-day EMA near $65,000. However, a stronger reversal condition only emerges if BTC re-enters the $68,000–$69,000 region, which corresponds to the 50-day EMA resistance cluster. Until this occurs, rallies remain statistically consistent with corrective retracements rather than trend reversals.
Conclusion: $60K as Structural Inflection Point
The current technical and macro configuration places Bitcoin at a critical threshold defined by converging FX volatility risk, inverted trend structure, and bear flag continuation geometry.
Sustained trading below $60,000, particularly a confirmed break of $59,000, increases the probability of a rapid liquidity-driven move toward $55,000–$55,300, consistent with historical deleveraging behavior observed during prior yen carry unwind episodes.
Until the moving average structure compresses and reverts to upward alignment, the prevailing regime remains defined by macro-driven downside pressure, liquidity contraction, and systematic risk reduction across leveraged portfolios.