
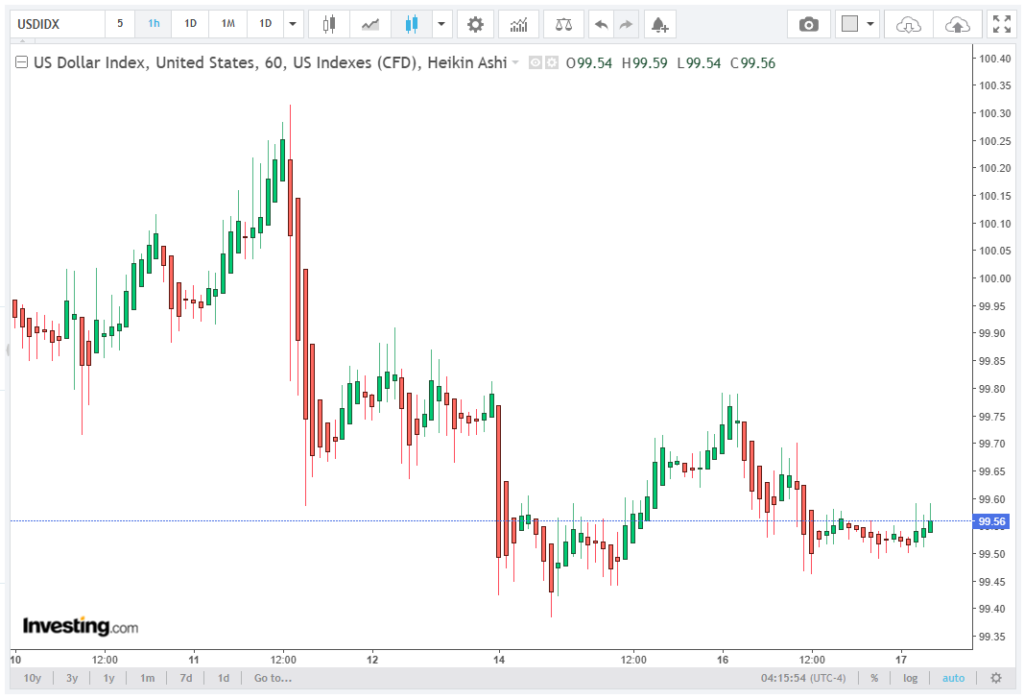
The United States Dollar Index (DXY) is currently trading in a tight consolidation range around 99.50, reflecting a market that is increasingly hesitant ahead of the Federal Reserve (FOMC) rate decision.
The index, which measures the Greenback against a basket of major global currencies, continues to struggle in attracting meaningful directional buying interest, remaining pinned near a one-week trough. Sollventis’ brokers walk readers through the subject step by step in this article, ensuring clarity and ease of understanding throughout.
This lack of momentum highlights a broader theme of market indecision, where traders are reluctant to establish large positions ahead of a potentially market-moving monetary policy update. As a result, the DXY is effectively trapped between macro uncertainty and technical compression, with volatility subdued but risk building beneath the surface.
Technical Structure: Bearish Tilt Within a Broader Range
From a technical standpoint, the DXY presents a mixed but increasingly fragile structure. The index recently closed below the 23.6% Fibonacci retracement level of the May–June upward move, signaling a short-term shift in momentum in favor of bearish traders.
Additionally, the Moving Average Convergence Divergence (MACD) indicator has turned slightly negative, reinforcing a mild downside bias. This suggests weakening momentum and a gradual loss of bullish pressure in the short term.
However, the Relative Strength Index (RSI) hovering around 53 paints a more neutral picture. Rather than confirming strong bearish momentum, it indicates a balanced market environment, where neither buyers nor sellers have full control. This divergence between indicators highlights the importance of caution, as the trend is not yet decisively one-sided.
Key Support Zones: Defensive Structure Remains Intact
Despite recent weakness, the broader technical framework still shows signs of underlying support. The DXY remains above the 200-day Exponential Moving Average (EMA), a key long-term trend indicator that continues to provide a structural bullish bias.
This EMA also aligns closely with the 50% Fibonacci retracement level, reinforcing it as a significant technical confluence zone. As long as the index holds above this area, the broader uptrend structure cannot be fully dismissed.
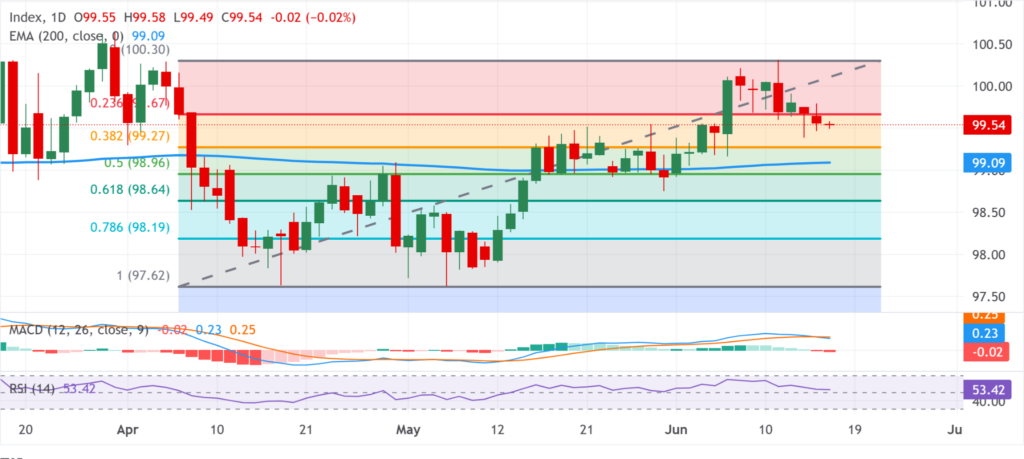
Immediate downside protection is seen at the 38.2% Fibonacci retracement level near 99.27, which serves as the first meaningful support zone. A break below this level would open the door toward the 200-day EMA region around 99.09, a critical pivot for medium-term trend direction.
Should selling pressure intensify further, deeper Fibonacci retracement floors come into focus at 98.96 and 98.64, levels that would likely attract stronger dip-buying interest and potential stabilization attempts.
Resistance Levels: Recovery Requires Strong Catalysts
On the upside, the DXY faces immediate resistance at the 23.6% Fibonacci level around 99.67, which now acts as a key technical barrier following the recent breakdown below it. A sustained move above this level would be required to signal a short-term reversal in bearish momentum.
Beyond this threshold, the next major resistance zone is located near the recent swing high at 100.30, which also aligns with the 0.0% Fibonacci anchor of the broader corrective structure. A break above this level would likely indicate a renewed bullish trend phase, potentially driven by stronger-than-expected macro catalysts such as a hawkish Fed surprise or renewed risk aversion in global markets.
Until such a breakout occurs, rallies are likely to be viewed as corrective rather than impulsive, limiting upside follow-through.
Outlook: Consolidation Before Volatility Expansion
The near-term outlook for the US Dollar Index remains defined by consolidation and compression, with traders awaiting a decisive catalyst from the Federal Reserve decision. The current structure suggests a market in equilibrium, where technical weakness is balanced by long-term support levels and neutral momentum readings.
While short-term signals lean slightly bearish due to the break below the 23.6% Fibonacci retracement and a soft MACD profile, the presence of the 200-day EMA support zone prevents a more aggressive downside outlook at this stage.
Importantly, the broader technical setup still favors a range-bound environment, where dips are likely to attract selective buying interest, especially near key Fibonacci and moving average supports.
Conclusion: Cautious Bias Within a Fragile Equilibrium
In conclusion, the DXY remains in a technically sensitive consolidation phase near 99.50, shaped by a combination of Fed uncertainty, easing geopolitical tensions, and mixed technical signals. While short-term momentum has weakened, the broader structure continues to show underlying resilience above major support levels.
Traders should remain cautious, as the market is positioned for a potential volatility expansion following the Fed announcement. Until a clear breakout or breakdown occurs, the dollar is likely to remain in a neutral-to-slightly bearish consolidation zone, with support near 99.27–99.09 and resistance near 99.67–100.30 defining the immediate trading landscape.