
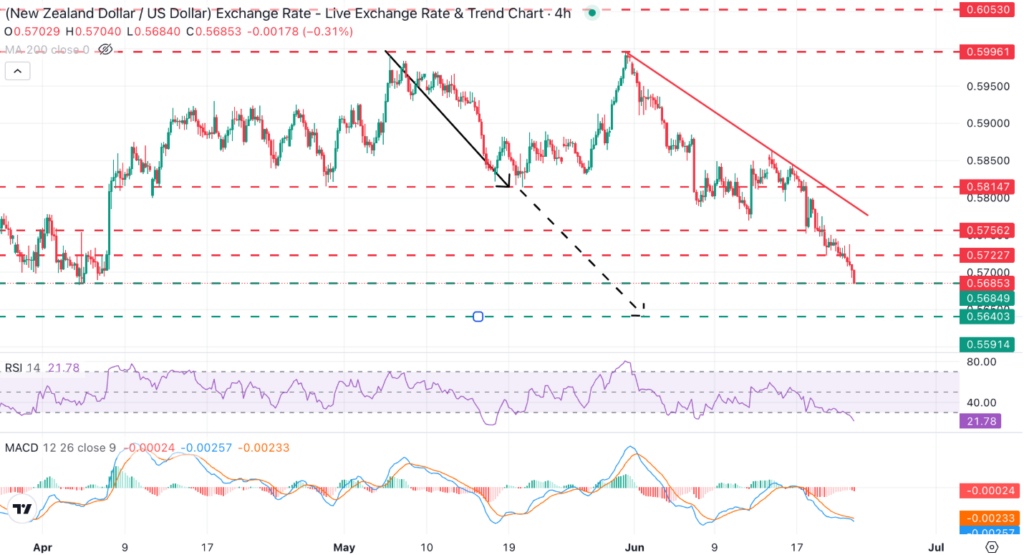
The NZD/USD pair continues its corrective phase, extending losses for a fifth consecutive session and trading firmly below the 0.5700 structural threshold. Price action has now compressed into the 0.5685–0.5683 demand zone, marking a retest of the year-to-date low at 0.5683, which represents a critical inflection point in the current market structure. In this article, Sollventis’s team of specialist brokers examines the topic in detail.
From a broader technical standpoint, the pair has transitioned into a lower-high, lower-low sequence on the 4-hour and daily timeframes, confirming a persistent bearish regime. The breakdown below 0.5725–0.5755 prior support cluster has removed key liquidity buffers, accelerating downside momentum into the current range.
The average true range (ATR 14) has expanded to approximately 0.0048–0.0052, indicating elevated volatility conditions consistent with trend continuation rather than consolidation.
Macro Drivers: Yield Differential and Risk Deleveraging
Widening US–New Zealand yield differentials continue to support downside pressure. US 10-year Treasury yields have moved into the 4.2%–4.5% range, while New Zealand sovereign yields remain lower, maintaining a structural capital flow advantage toward USD assets.
Market pricing from futures now implies roughly a 70% probability of a 25 bp rate hike in September, with total cycle tightening expectations around +25 to +50 bps. This repricing has sustained USD strength, visible in continued upside across yield-sensitive FX pairs.
On the risk side, ongoing geopolitical uncertainty tied to maritime energy transit routes has lifted global risk premia. This has reduced demand for higher-beta currencies like NZD, especially given unresolved conditions affecting key corridors handling ~18%–22% of global oil flows.
Together, yield divergence and elevated risk aversion create a strongly asymmetric setup favoring continued USD accumulation.
Momentum and Indicator Profile: Bearish Continuation Phase
On the 4-hour chart, momentum indicators remain aligned with downside continuation. The MACD histogram is persistently negative, printing values around -0.0004 to -0.0007, indicating sustained bearish momentum without evidence of bullish divergence.
The MACD signal line spread remains negative, confirming that short-term trend acceleration is still skewed to the downside.
The Relative Strength Index (14) is currently positioned near 29–32, reflecting oversold conditions, but importantly, no structural reversal signal has formed. Historically, in trending environments, RSI can remain below 30 for extended periods when macro momentum dominates micro mean-reversion signals.
The absence of a bullish divergence between price lows and RSI lows reinforces the probability of trend continuation rather than exhaustion.
Volume-weighted analysis suggests distribution has been concentrated near the 0.5700 breakdown level, which now acts as dynamic resistance rather than support.
Key Support Architecture: 0.5683 as Trigger Zone
Widening US–New Zealand yield differentials continue to support downside pressure. US 10-year Treasury yields have moved into the 4.2%–4.5% range, while New Zealand sovereign yields remain lower, maintaining a structural capital flow advantage toward USD assets.
Market pricing from futures now implies roughly a 70% probability of a 25 bp rate hike in September, with total cycle tightening expectations around +25 to +50 bps. This repricing has sustained USD strength, visible in continued upside across yield-sensitive FX pairs.
On the risk side, ongoing geopolitical uncertainty tied to maritime energy transit routes has lifted global risk premia. This has reduced demand for higher-beta currencies like NZD, especially given unresolved conditions affecting key corridors handling ~18%–22% of global oil flows.
Together, yield divergence and elevated risk aversion create a strongly asymmetric setup favoring continued USD accumulation.
Resistance Structure: Layered Supply Zones Above Market
On the upside, immediate resistance is located at 0.5725, aligning with the previous micro swing low and short-term supply rejection zone. Above this, the 0.5755–0.5765 band represents a denser liquidity cluster where prior breakdown acceleration originated.
The broader resistance ceiling remains anchored at the descending trendline, currently positioned near 0.5780, which intersects with the 20-period and 50-period moving averages on the 4-hour chart, reinforcing confluence resistance.
The 200-period moving average sits higher near 0.5820, marking the upper boundary of the medium-term bearish structure. Price remains significantly below this level, confirming a sustained bearish trend separation across moving average systems.
Outlook: Bearish Continuation Favored Below Structural Low
The NZD/USD technical framework remains decisively skewed toward downside continuation, with macro and micro signals broadly aligned. A sustained yield differential advantage in favor of the USD, persistent risk-off positioning across markets, and a confirmed bearish momentum structure collectively reinforce the case for continued downside pressure in the prevailing trend.
A decisive break and daily close below 0.5683 would validate the next extension toward 0.5640, with potential overshoot into lower liquidity zones if volatility remains elevated.
Only a sustained recovery above 0.5780–0.5820, accompanied by momentum reversal in MACD and RSI recovery above 50, would begin to neutralize the current bearish regime.
Until then, price behavior continues to reflect a trend-dominant market environment with downside skew intact, and the path of least resistance remains lower.