
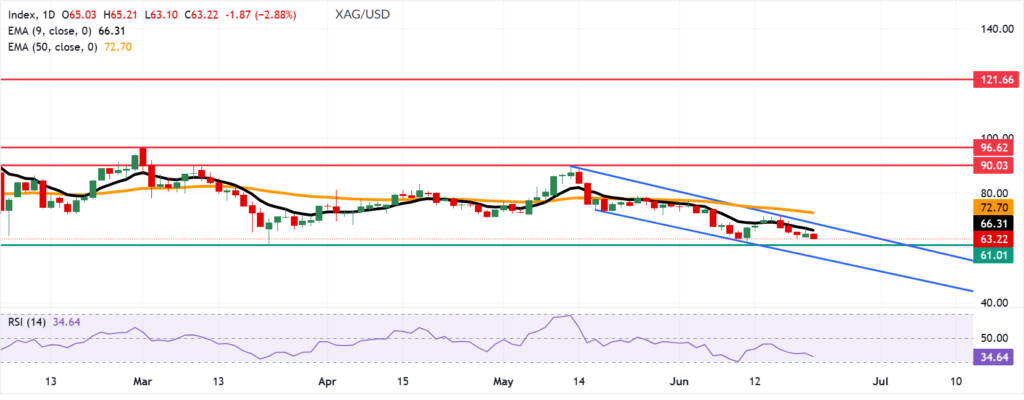
The XAG/USD pair continues to trade under sustained bearish pressure, extending its decline toward the $63.00 psychological zone after losing more than 3% in recent sessions. Spot silver is currently hovering near $63.20 per troy ounce, reflecting persistent weakness within a well-defined descending channel structure on the daily timeframe. The expert brokers at Sollventis explore this topic in depth in the article.
The broader market configuration remains aligned with a downtrend continuation phase, with price action failing to reclaim any significant dynamic resistance levels. The repeated rejection of upward attempts confirms that the market structure is still dominated by lower highs and lower lows, a classical bearish formation indicating ongoing downside risk.
Trend Structure and Moving Average Configuration
From a technical standpoint, XAG/USD remains decisively positioned below both the 9-day EMA at $66.31 and the 50-day EMA at $72.70, reinforcing a clear multi-layered bearish alignment.
The separation between price and these key exponential moving averages indicates strong trend persistence, with both EMAs acting as overhead resistance zones. The negative EMA spread, where the 9-day EMA remains significantly below the 50-day EMA while both sit above current price levels, confirms a structurally entrenched bearish momentum regime.
The inability of silver to reclaim the $66.31 level suggests that short-term rebounds are being systematically sold into, maintaining pressure within the lower half of the descending price channel.
Momentum Analysis: RSI and Bearish Strength
The 14-day Relative Strength Index (RSI) is currently at 34.64, just above the oversold level of 30. This indicates that bearish momentum remains dominant, though downside pressure may be starting to stabilize.
RSI is still below the 50 neutral midpoint, confirming that bullish momentum has not regained control. Readings in the 30–40 range typically align with extended downtrends that may see temporary corrective rebounds rather than full reversals.
Overall, the RSI suggests bearish momentum is still active but potentially slowing. A move back above 45–50 would be needed to signal a more meaningful shift in trend bias.
Critical Support Zones and Downside Extension Risk
The key structural support is at $61.01, the six-month low from March 23, and a major liquidity zone where prior demand has appeared.
A break below $61.01 would confirm continuation of the broader bearish trend and expose the lower boundary of the descending channel near $57.50, which acts as the next major technical target and support area if no reversal catalyst emerges.
From current levels, this implies a potential downside extension of roughly 8%–10% if bearish momentum accelerates further.
Resistance Levels and Recovery Constraints
On the upside, immediate resistance is firmly at the 9-day EMA of $66.31, which serves as the first dynamic barrier for any corrective rebound. A break and close above this level would signal initial stabilization, but price would still face structural resistance at the upper boundary of the descending channel near $69.70, a high-probability rejection zone due to trend resistance and prior supply.
Beyond that, the 50-day EMA at $72.70 remains the key medium-term resistance. A sustained move above $72.70 would be required to neutralize the current bearish structure and shift the market into a neutral-to-bullish consolidation phase. Until then, all upside moves are considered counter-trend retracements within a bearish channel.
Volatility Structure and Market Behavior
Recent price behavior indicates increasing sensitivity to resistance levels, with intraday rallies failing to maintain momentum beyond the $66.00–$66.50 zones. This repeated rejection pattern reflects strong supply-side dominance and limited absorption capacity from buyers.
Volatility remains moderately elevated, with price oscillations occurring within a tightening range inside the broader descending channel. This type of structure often precedes either a breakdown toward lower support or a corrective bounce toward channel resistance, depending on liquidity shifts.
The current price compression beneath key EMAs suggests that volatility expansion is more likely to resolve in the direction of the prevailing downtrend continuation unless a structural breakout occurs above $69.70.
Medium-Term Technical Outlook
The medium-term structure of XAG/USD remains decisively bearish, supported by persistent trading below the 9-day EMA ($66.31) and 50-day EMA ($72.70), sustained RSI weakness at 34.64, and intact descending channel formation on the daily chart.
As long as the price remains below $66.31, the probability distribution favors continued pressure toward $61.01, followed by potential extension into the $57.50 channel base.
A meaningful trend reversal would require a multi-session close above $72.70, accompanied by RSI recovery above 50, which would signal a structural transition from bearish trend continuation to range or bullish recovery phase.
Until then, the dominant technical condition remains a bearish trend regime with controlled downside expansion and limited upside follow-through potential.