
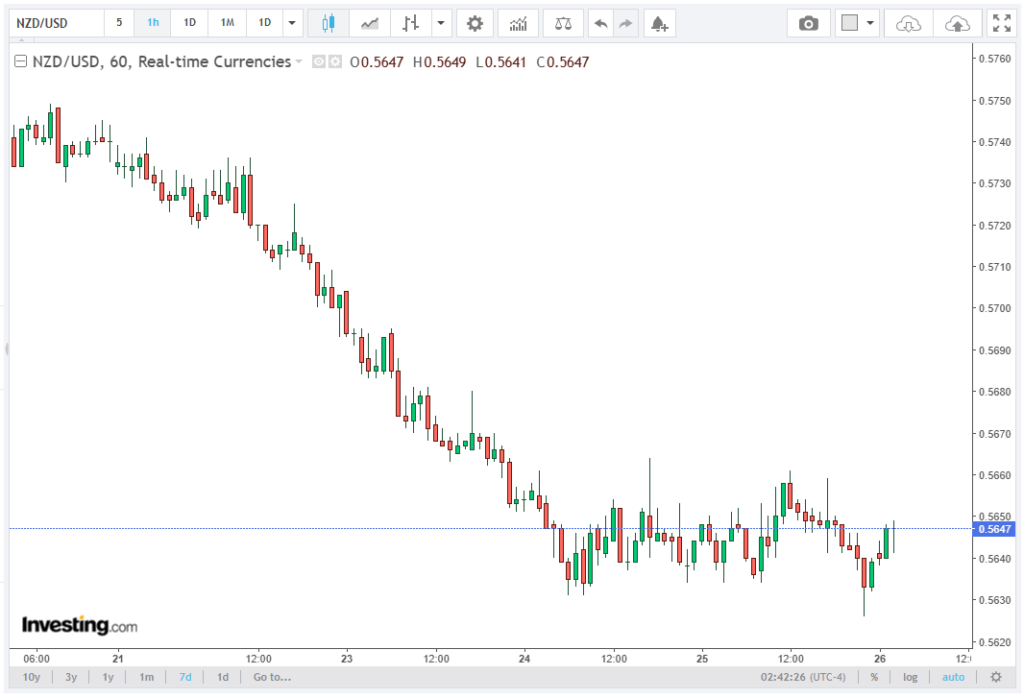
The NZD/USD pair continues to trade under a well-defined bearish structure, extending its decline that began on 17 June and holding near 0.5650 in recent Asian trading sessions. Throughout this article, the brokers at Fonndure examine this topic from multiple perspectives.
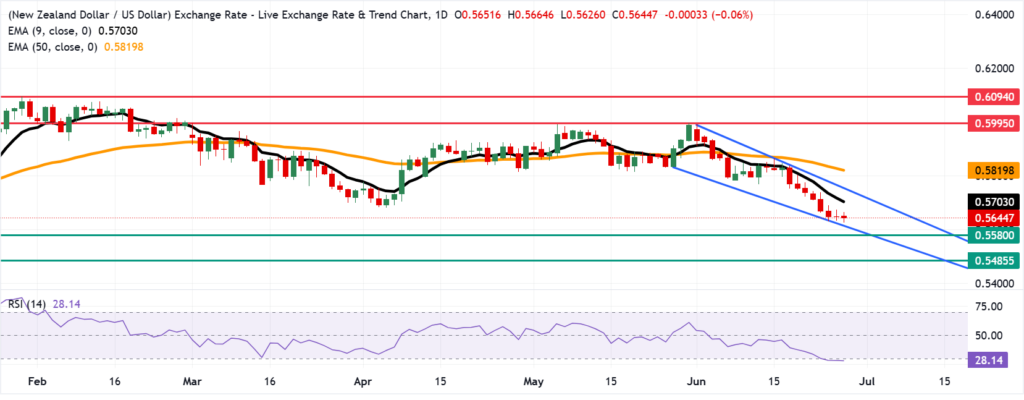
Price action remains locked inside a descending channel on the daily timeframe, characterized by a sequence of lower highs and lower lows, confirming sustained directional pressure to the downside.
The current position near 0.5650 places the spot closer to the lower half of the channel, with structural flow still pointing toward the next key inflection zone at the channel support boundary near 0.5620. This level now acts as the immediate technical reference for potential continuation or short-term stabilization.
Trend Indicators: EMA Alignment Confirms Bearish Momentum
The moving average configuration continues to reinforce a strong downtrend regime. NZD/USD is trading below both key trend filters:
The 9-day EMA is positioned at 0.5703, while the 50-day EMA is located near 0.5820. The gap between spot price (0.5650) and these averages confirms a persistent negative trend deviation of approximately -53 pips below the 9-day EMA and -170 pips below the 50-day EMA.
This dual resistance structure indicates that any corrective bounce is likely to encounter layered supply pressure between 0.5700 and 0.5820, where dynamic resistance levels converge. As long as the price remains below 0.5703, the short-term trend bias remains firmly bearish, with continuation probability elevated.
Momentum Conditions: RSI at 28 Signals Oversold but No Reversal Confirmation
The 14-day Relative Strength Index (RSI) currently reads 28, placing NZD/USD deep within oversold territory below the standard 30 threshold. This reflects sustained downside momentum and accelerated selling pressure over recent sessions.
However, despite this oversold reading, there is no confirmed bullish divergence between price and RSI, and no evidence of momentum reversal structure, such as higher lows in RSI against lower lows in price. Historically, RSI readings in the 26–30 zone during strong trends often precede either:
A continuation leg after brief consolidation, or a technical rebound toward the 38–45 RSI range without structural trend reversal. At present, momentum conditions indicate exhaustion risk, not reversal confirmation.
Immediate Support Structure: 0.5620 in Focus
The first key structural support remains the descending channel lower boundary at 0.5620. This level represents the current equilibrium floor of the bearish channel and is now the most immediate technical inflection point.
A sustained break below 0.5620 would represent a channel breakdown confirmation, increasing downside acceleration risk. Below this zone, the next liquidity cluster is located at 0.5580, which corresponds to the 14-month low recorded in November 2025.
The 0.5580 level is a medium-term structural pivot. A daily close beneath this level would confirm continuation of the broader bearish cycle and expose deeper downside extension.
If bearish momentum persists beyond this threshold, the next major structural reference lies at 0.5485, marking the lowest level since March 2020. This zone represents a long-term support region where historical demand previously emerged.
Resistance Layers: Dynamic and Static Barriers Above Price
On the upside, recovery attempts remain capped by a dense resistance structure. The first barrier is the 9-day EMA at 0.5703, which aligns closely with recent intraday rejection zones. Price has repeatedly failed to sustain movement above this level, confirming its role as immediate dynamic resistance.
Beyond this, the upper boundary of the descending channel is located near 0.5760, representing the first structural resistance ceiling within the broader downtrend framework. This zone coincides with prior swing high rejection areas, reinforcing its technical significance.
Further resistance is concentrated at the 50-day EMA near 0.5820, which also aligns with previous distribution zones. A recovery above this level would be required to neutralize the medium-term bearish structure and shift trend classification toward neutral conditions.
Until price reclaims at least 0.5703, all upward movements remain classified as corrective retracements within a bearish trend, rather than trend reversal attempts.
Technical Outlook: Bearish Bias Maintained Below Key Averages
Overall, NZD/USD remains structurally weak with a clearly defined bearish trend framework supported by:
Persistent trading below the 9-day EMA at 0.5703 and 50-day EMA at 0.5820, sustained movement within a descending channel, and momentum conditions reflected by an RSI of 28, indicating oversold but unconfirmed reversal conditions.
As long as the price remains below 0.5703, downside continuation toward 0.5620 remains the base scenario. A break of this level increases the probability of extension toward 0.5580, with further downside exposure opening toward 0.5485 in an extended bearish cycle.
In summary, the NZD/USD technical configuration continues to favor bearish continuation, with oversold momentum conditions suggesting potential for short-lived rebounds rather than structural recovery.