
The Dow Jones Industrial Average closed above 52,000 for the first time on June 16, 2026, adding 329 points on the day. At the exact same time, the Nasdaq fell 1.15%, the S&P 500 slipped 0.08%, and the Russell 2000 dropped 0.63%.
That four-way split is not noise or coincidence, and the brand’s lead financial analyst stresses that Nummixo sees it as the real signal for stock investors heading into the Fed’s June 17 rate decision.
Record High on the Dow, Red Everywhere Else
The Dow’s advance on June 16 was driven largely by industrial, financial, and consumer names rather than technology stocks. Chipmakers pulled back sharply after a ceasefire-fueled rally earlier in the week, and the Cboe Volatility Index (VIX) moved from steep intraday declines to a modest advance, rising above 16 by the close.
That combination, Dow green, Nasdaq red, VIX rising, points clearly to a deliberate rotation trade rather than broad market confidence expanding across sectors.
Money was not leaving equities entirely but moving out of expensive, rate-sensitive technology names and into sectors with lower multiples and more predictable near-term earnings profiles ahead of a major central bank event.
This is a pattern that repeats reliably ahead of Fed meetings when rate direction is uncertain. Investors reduce risk in high-multiple names and add exposure to names that perform acceptably even in a prolonged high-rate environment, which is exactly where the Dow’s industrial and financial components sit.
What the Rotation Is Actually Saying
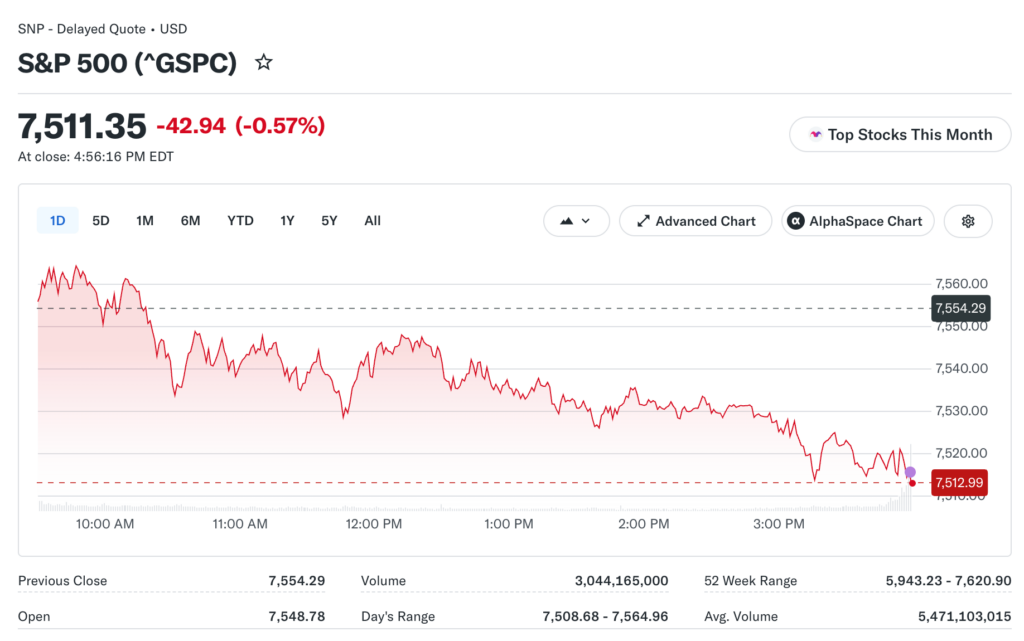
The S&P 500 closed at 7,548.60 and the Nasdaq at 26,376.34 after June 16’s full session, with technology having driven 19.76% sector gains in May while eight of eleven S&P sectors fell during that same month. That level of concentration means any meaningful reversal in tech sentiment hits the broader index hard regardless of what other sectors are doing.
The divergence between the Dow and Nasdaq on June 16 was partly a response to the upcoming Fed decision and partly a delayed reaction to stretched valuations in technology that the ceasefire-driven rally had temporarily masked. Both factors were operating simultaneously in the same session.
Small Caps Tell the Honest Story
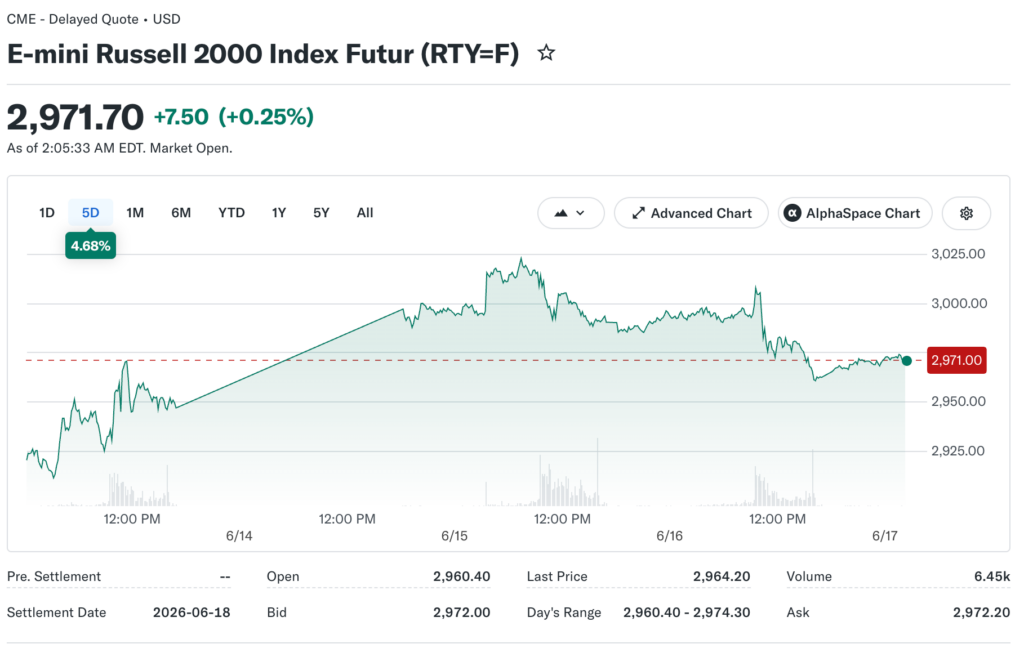
The Russell 2000 fell 0.63% on a day the Dow hit an all-time record, and that divergence carries important information about the actual breadth of economic optimism in the current market.
Smaller companies depend far more heavily on domestic credit conditions and genuine economic confidence than mega-cap names do, making them more sensitive indicators of real underlying sentiment.
When small caps lag during a Dow record, it typically signals that the optimism is narrow and name-specific rather than reflecting a broad improvement in economic conditions or business credit availability across the economy. SpaceX (SPCX) jumped 4.8% on June 16, closing with a market cap of $2.65 trillion and roughly $8 billion above Amazon’s closing valuation on the same day.
The Earnings Concentration Problem in Plain Numbers
May’s S&P 500 earnings picture illustrated the concentration problem in stark and specific terms. Information Technology posted 54.3% earnings growth for the period, but strip out Nvidia and Micron and that number drops immediately to 30.1%.
Communication Services showed 48.9% earnings growth, but remove Alphabet and Meta and it flips entirely to a 4.1% decline for the remaining sector components.
A handful of companies are doing the earnings work for the entire index while the rest of the market treads water or declines. Walmart already flagged margin drag from elevated energy costs at Brent crude above $100 per barrel, a warning that suggests cost pressure is spreading into consumer-facing businesses even as tech remains insulated.
If that pressure shows up visibly across Consumer Staples and Industrials in upcoming Q2 reports, the narrow tech leadership becomes the only remaining thing keeping index-level returns from turning negative for the quarter.
Separating Real Breadth From a Convincing Mirage
The Bank of America pre-market-peak checklist hit 70% in June 2026, matching the average reading seen at the last seven major market tops over the past 35 years of market data.
That indicator does not predict timing with precision but identifies cycle position relative to historical turning points, and being at 70% tells investors how far along the current cycle sits compared to where major tops have historically formed.
Tracking the equal-weight S&P 500 ETF (RSP) alongside the standard cap-weighted SPY gives investors a clean, real-time read on whether the rally has genuine depth beneath it.
A widening performance gap between the two signals increasing concentration where fewer stocks are doing more of the work, while a narrowing gap signals expanding participation and a rally with a broader, more structurally durable foundation.
The Dow hitting a record is a headline that feels good and generates attention. The Nasdaq, Russell 2000, and S&P 500 all closing lower on the exact same day is the actual signal worth spending time analyzing carefully before the next investment decision gets made.