
The USD/JPY cross is trading around 161.75, hovering near its highest levels in 13 months after repeated attempts to push through the 161.90 area met resistance during Wednesday’s session.
The intraday structure reflects a controlled consolidation rather than a trend reversal, with price still operating inside a medium-term bullish channel. This article offers a detailed exploration of the topic, led by Findtech Group‘s team of expert brokers.
Selling pressure has been concentrated near 161.85 to 161.95, where liquidity pockets and growing intervention chatter from Japanese officials have repeatedly capped intraday advances.
Despite this resistance, downside momentum remains limited, indicating that the market is still balancing dollar strength from a more hawkish Fed rate outlook against rising yen intervention risk.
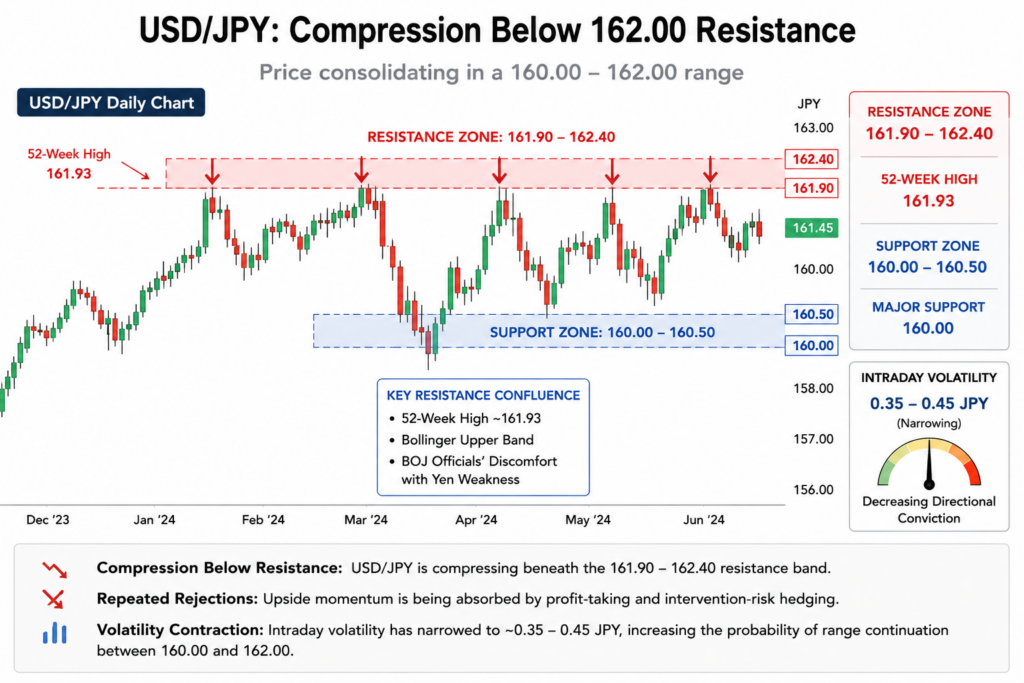
Price Structure: Compression Below the 162.00 Resistance Band
From a microstructure perspective, USD/JPY is compressing beneath a clearly defined 161.90 to 162.40 resistance zone. This area represents a confluence of the pair’s 52-week high near 161.93, Bollinger upper-band resistance, and a zone where Bank of Japan officials have signaled growing discomfort with yen weakness.
Repeated rejections from this zone indicate that the market is in a volatility contraction phase, where upside momentum is being absorbed by profit-taking and intervention-risk hedging. Intraday volatility has narrowed to approximately 0.35 to 0.45 JPY, suggesting decreasing directional conviction and an increasing probability of range continuation between 160.00 and 162.00.
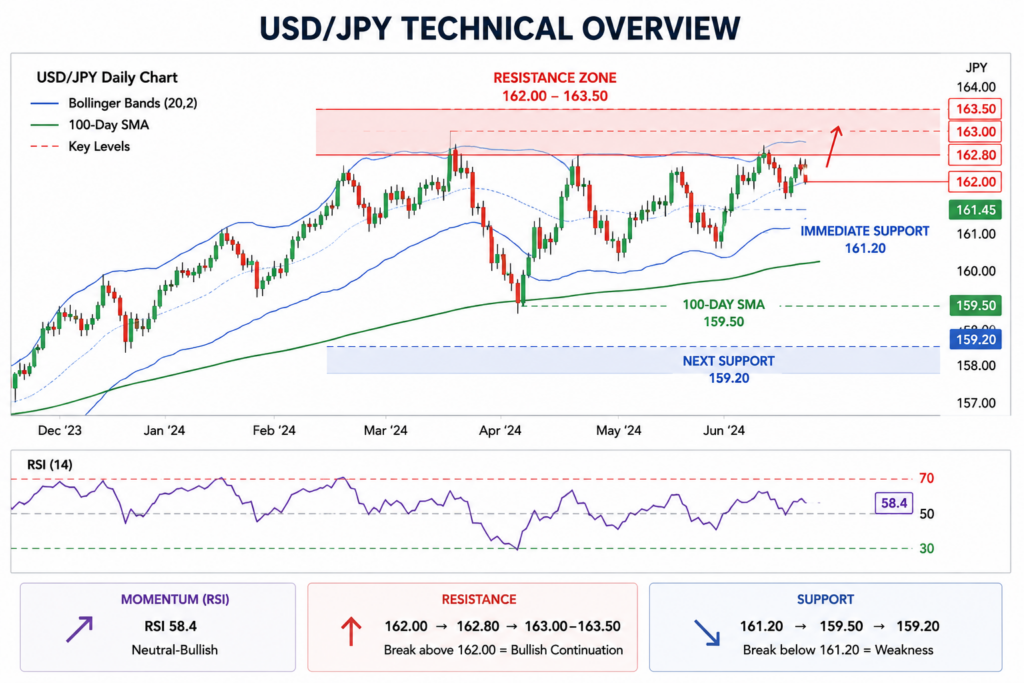
Technical Structure: Bollinger and SMA Framework
On the daily timeframe, USD/JPY remains technically constructive as long as price holds above the 100-day Simple Moving Average (SMA) at approximately 159.50. This moving average continues to act as a dynamic structural floor, reinforcing the broader bullish trend classification despite the recent stall near the highs.
Price is currently oscillating within the upper half of the Bollinger Band envelope, which spans roughly from 159.20 to 162.50. The inability to expand decisively toward the upper band reflects waning upside momentum rather than trend failure.
The Bollinger middle band at 160.80 remains the key pivot. Sustained rejection below this level would confirm mean-reversion pressure, while a clean break above 162.00 would signal a return of trend expansion conditions.
Momentum Analysis: RSI Signals Neutral-Bullish Drift
The Relative Strength Index (RSI) is currently positioned at 58.4, reflecting a mild bullish tilt within a neutral regime. This reading sits above the 50 equilibrium level but well below the 70 overbought threshold, indicating that the market is consolidating rather than exhausting its trend.
Historically, RSI values in this range during USD/JPY uptrends tend to correspond with pause phases rather than reversals, especially when price remains above the 100-day SMA. Momentum compression here is consistent with current price behavior, suggesting that volatility is being stored for a potential breakout once the Fed’s rate path or BoJ policy signals reassert directional pressure.
Key Resistance Cluster: 162.00 to 163.50 Expansion Zone
Immediate resistance sits at 162.00, aligning closely with the Bollinger upper band and acting as the primary short-term trigger level. A sustained break above 162.00 would shift the structure from consolidation to bullish continuation, opening a pathway toward 162.80, followed by a psychologically significant 163.00 to 163.50 zone.
Beyond that range, price would enter territory not seen in well over a year, where intervention risk from Japanese authorities rises substantially. Without a confirmed breakout above 162.00, upside remains technically capped and reactive rather than impulsive.
Support Structure: 161.20 Fragility and 159.50 Defense Line
Immediate downside focus remains on 161.20, which has become a short-term liquidity defense level. Repeated tests of this zone indicate active absorption, but weakening support integrity. A decisive break below 161.20 would expose the 100-day SMA at 159.50, a structurally important level where medium-term buyers are expected to re-engage.
Below that, the next technical cushion sits near 159.20, corresponding with the lower Bollinger Band. This zone typically represents a statistical oversold extension, where mean-reversion probability increases significantly. The broader bullish structure would only begin to deteriorate on a sustained close below 159.20.
Conclusion: Consolidation With Mild Bullish Structural Bias
USD/JPY remains technically in a mildly bullish medium-term configuration, supported by price stability above the 100-day SMA near 159.50 and sustained positioning within the upper Bollinger regime. However, short-term dynamics are dominated by intervention-risk headlines out of Tokyo, keeping price capped below 162.00 and reinforcing a range-bound consolidation structure.
The market is effectively locked between a 161.20 to 159.50 support cluster and a 162.00 resistance ceiling. A breakout above 162.00 would re-establish bullish expansion toward 163.00 and beyond, while a break below 159.50 would signal deeper corrective pressure toward 159.20. Until either level resolves, USD/JPY is expected to remain in a compressed technical equilibrium phase with a mildly bullish underlying bias.