
The US Dollar Index came under renewed selling pressure after softer inflation figures reduced expectations of an immediate interest-rate increase. The index fell toward the 100.70 region as Treasury yields declined and several major currencies strengthened against the dollar.
Brokers from AchievementsAI.com examine whether the recent pullback is a temporary correction within the broader 2026 uptrend or the start of a deeper bearish move. The Dollar Index dropped about 0.6% following the inflation release, while the US 10-year Treasury yield slipped toward 4.57%.
Technical Structure Faces an Important Test
The Dollar Index has advanced for much of 2026, but recent price action has become less decisive. The latest decline has brought the index closer to an area where several technical signals may converge.
The 20-day Exponential Moving Average is the first indicator to watch. Holding above it could allow buyers to regain control after the inflation-driven selloff. A sustained break below it would suggest that short-term momentum is weakening.
The 50-day EMA is the more important medium-term guide. Remaining above it would preserve the broader bullish structure.
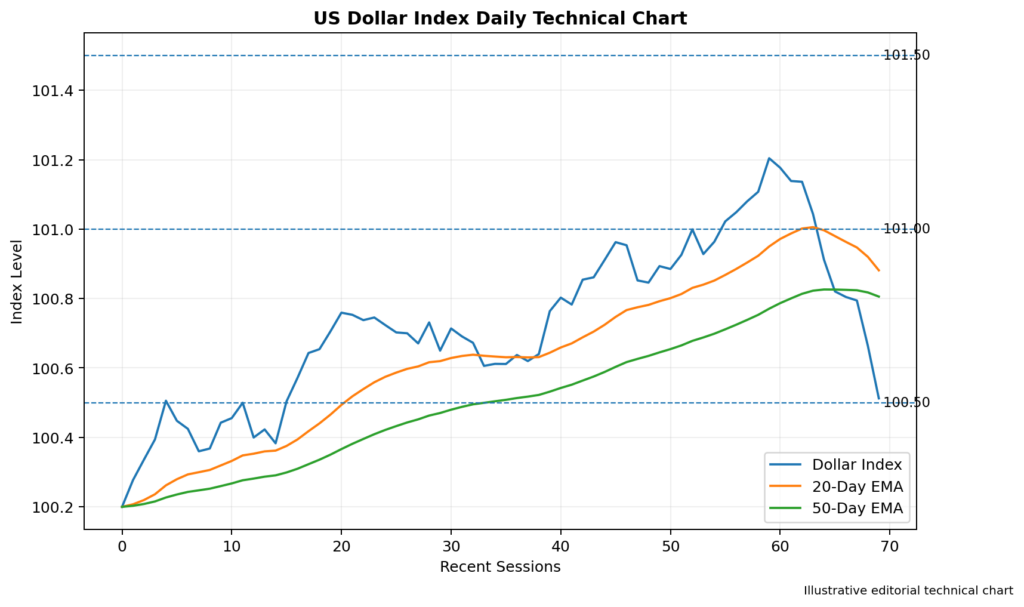
Image 1: US Dollar Index Daily Chart With the 20-Day and 50-Day EMAs, Support Near 100.50 and Resistance at 101.50
RSI Shows Momentum Has Weakened
The 14-day Relative Strength Index has moved lower as the dollar retreated. A fall toward the neutral 50 level would indicate that the strong buying momentum seen earlier in the year has faded.
If RSI remains above 50 and begins turning higher, the index could attempt another recovery. A confirmed move below 50 would strengthen the bearish case and increase the possibility of a test of lower support.
Resistance Levels Above 101.00
The first resistance area is located around 101.00. A move back above this level shows that buyers are responding to the decline.
Stronger resistance may appear near 101.50, where recent price action and short-term technical indicators could limit an initial recovery. A confirmed break above 101.50 may place 102.00 back in focus.
Beyond that level, the next target may emerge around 102.50. Reaching this area would require renewed support from Treasury yields or stronger economic data.
The main resistance levels are 101.00, 101.50, 102.00, and 102.50.
Support Levels and Downside Risk
Immediate support is positioned around 100.50. This area may determine whether the current decline remains a controlled correction.
A daily close below 100.50 could expose the psychological 100.00 level.
If the index fails to stabilize at 100.00, deeper support may be found near 99.50. A sustained move beneath this level would represent a more significant deterioration in the 2026 technical structure.
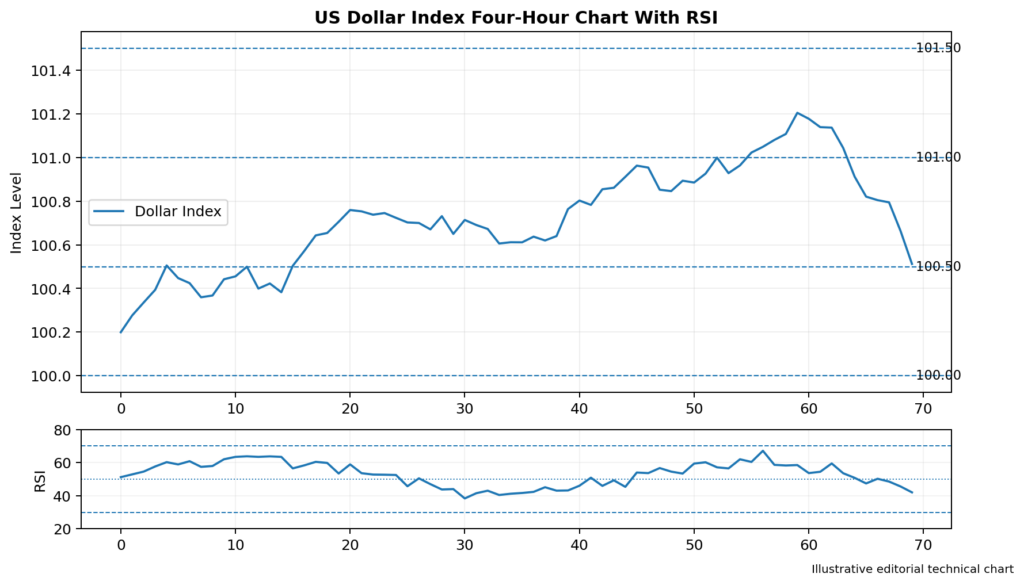
Image 2: US Dollar Index Four-Hour Chart With RSI, Support at 100.50 and 100.00, and Resistance at 101.00 and 101.50
Softer Inflation Reduces Rate-Hike Expectations
The latest decline followed weaker-than-expected US inflation data. Core consumer inflation slowed to 2.6% year over year in June, while the monthly core reading was unchanged.
Producer prices then fell 0.3% during the month, compared with expectations for no change. The figures reduced the perceived probability of a July interest-rate increase.
Markets placed the likelihood of rates remaining unchanged at the July meeting at more than 80% after the consumer inflation report. This shift placed pressure on Treasury yields and weakened the dollar against major peers.
However, inflation remains above the central bank’s preferred target. Higher oil prices could also raise transport and production costs, making the longer-term policy outlook uncertain.
Major Currencies Recover Against the Dollar
The softer dollar supported sterling, the euro, and several commodity-linked currencies. The British pound moved toward 1.3440, while the euro also gained ground.
The Japanese yen also received support from lower US yields, although domestic uncertainty may keep currency moves uneven.
Trading Implications
The short-term outlook is cautious while the Dollar Index remains below 101.00 and its nearest resistance zone.
A recovery above 101.50 could restore bullish momentum and expose 102.00. A break below 100.50 would instead shift attention toward 100.00 and 99.50.
RSI direction and the reaction around the 20-day EMA may provide the clearest early signals.
Conclusion
The US Dollar Index is testing an important technical area after softer inflation data reduced expectations of an immediate rate increase.
Resistance is positioned at 101.00, 101.50, 102.00, and 102.50. Support can be found around 100.50, 100.00, and 99.50.
The broader trend may remain constructive above the 50-day EMA, but near-term momentum has weakened. The next move will likely depend on whether buyers defend support or the index confirms a deeper break below 100.50.