
Natural gas prices remain under pressure after retreating from their 2026 highs, with the market now approaching one of its most important long-term technical support levels. BCR Limited examines the latest price action, highlighting how technical indicators, market sentiment, and upcoming inventory data could influence the commodity’s next major move.
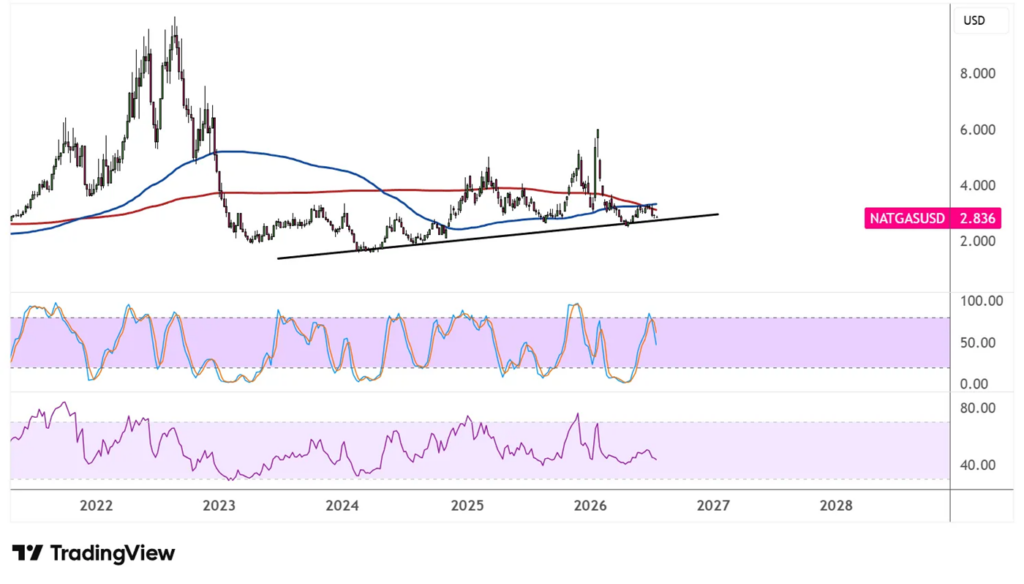
Although short-term momentum continues to favor sellers, the broader long-term structure has not yet been broken. As a result, investors are closely monitoring whether buyers will once again defend the multi-year ascending trendline that has supported prices since 2023.
Long-Term Support Faces Another Test
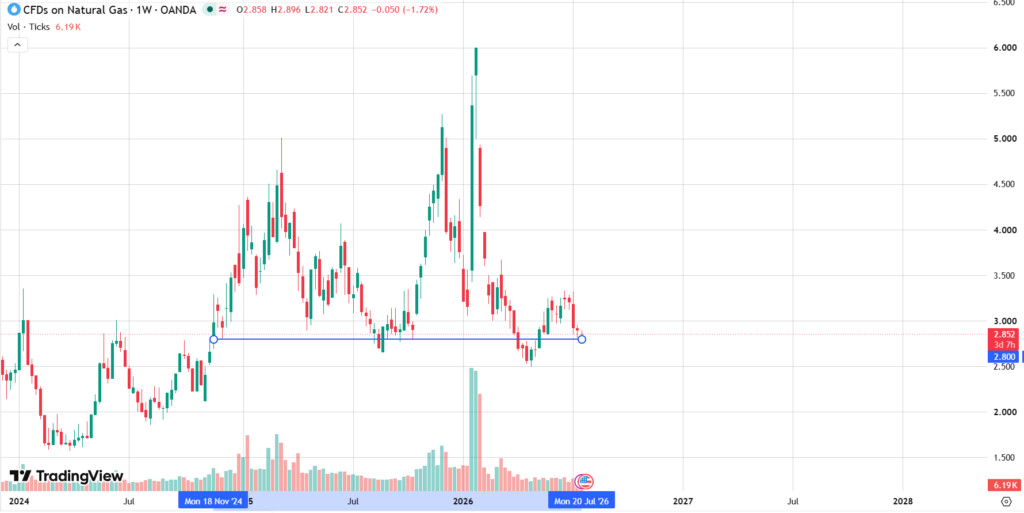
Natural gas has declined significantly from its 2026 peak near $5.80, bringing prices back toward the critical $2.80 region.
This area coincides with a long-term ascending trendline that has connected multiple higher lows since the market bottomed in 2023. For more than two years, this technical structure has helped maintain the broader consolidation despite periods of elevated volatility.
As prices revisit this support once again, traders are assessing whether buyers have sufficient conviction to preserve the longer-term trend or whether a deeper correction could begin if the level fails.
Moving Averages Signal Increasing Caution
While long-term support remains intact, moving averages suggest that downside risks have increased.
The 100-week Simple Moving Average (SMA) is beginning to move below the 200-week SMA, a development that often reflects weakening medium-term momentum. Although this crossover does not guarantee further declines, it suggests that bullish momentum has faded compared with earlier in the year.
Should natural gas successfully rebound from current levels, the first technical objective would likely emerge around the $3.40-$3.70 area, where both moving averages converge. Recovering this zone would strengthen the case for a broader recovery toward previous swing highs.
Momentum Indicators Continue Favoring Sellers
Current momentum indicators also point to a cautious short-term outlook.
The Relative Strength Index (RSI) remains below the neutral 50 level, reflecting fading bullish momentum without yet reaching deeply oversold conditions. At the same time, the Stochastic Oscillator continues pointing lower, suggesting selling pressure may not have fully exhausted itself.
Even so, momentum indicators can shift quickly if buyers successfully defend the current support level. A rebound from this area could improve sentiment considerably, particularly if accompanied by stronger trading volumes and improving macroeconomic conditions.
Inventory Data Could Provide the Next Catalyst
Beyond technical analysis, traders are also preparing for upcoming natural gas inventory data, which remains one of the market’s most closely watched fundamental indicators.
Storage levels provide valuable insight into the balance between supply and demand, often influencing short-term price movements across the energy market. Unexpected inventory changes can quickly alter market expectations, particularly during periods of elevated volatility.
At the same time, broader market sentiment, US Dollar performance, weather forecasts, and expectations for industrial energy demand continue shaping price behaviour.
Seasonal consumption patterns also remain important, as stronger cooling or heating demand can rapidly alter inventory expectations and price dynamics. Together with technical signals, these factors will likely determine whether current support evolves into a sustained recovery or a continuation of the broader decline.
Technical Levels Could Shape the Next Major Move
While fundamentals remain important, many traders are also paying close attention to several technical price levels that could influence sentiment over the coming weeks.
A sustained rebound from the $2.80 support area would suggest that long-term buyers are still defending the broader uptrend established since 2023. Such a scenario could encourage a recovery toward the $3.40-$3.70 region, where longer-term moving averages may provide the first significant resistance.
On the other hand, a decisive weekly close below current support would likely shift attention toward lower historical trading ranges, increasing the probability of a broader corrective phase. Because natural gas has historically experienced periods of elevated volatility, confirmation is often more important than anticipating the initial move.
For long-term investors, monitoring both technical confirmation and evolving supply-demand fundamentals may provide a more balanced framework than reacting solely to short-term price fluctuations or individual market headlines.
Conclusion
Natural gas is approaching a technically significant moment as prices test a support level that has remained intact for more than two years. While momentum indicators continue favoring sellers, the broader trend has yet to confirm a structural breakdown.
For investors, the coming sessions may prove decisive. A successful defence of the $2.80 support area could encourage a recovery toward higher resistance levels, while a sustained break below this long-term trendline would likely shift attention toward a much deeper corrective phase.