
The US 10-year Treasury yield is approaching an important technical threshold after several weeks of narrowing price action. The benchmark recently traded around 4.59%, having briefly reached 4.6358%, its highest level since May 21.
Brokers from Fondesia.com examine whether the current period of unusually low volatility could lead to a breakout toward 5.00% or a retreat toward the lower end of the recent trading range.
Symmetrical Triangle Nears Resolution
The daily chart shows the 10-year yield moving within a symmetrical triangle. This pattern develops when a market produces lower highs and higher lows, causing its trading range to narrow.
A triangle represents a temporary balance between buyers and sellers. As the yield moves closer to the end of the formation, the possibility of a larger directional move increases.
The pattern does not predict whether yields will rise or fall. Traders generally wait for a sustained close beyond one of the trend lines before treating the move as a confirmed breakout.
The upper boundary sits close to the recent high at 4.6358%, while initial support is located near 4.52%.
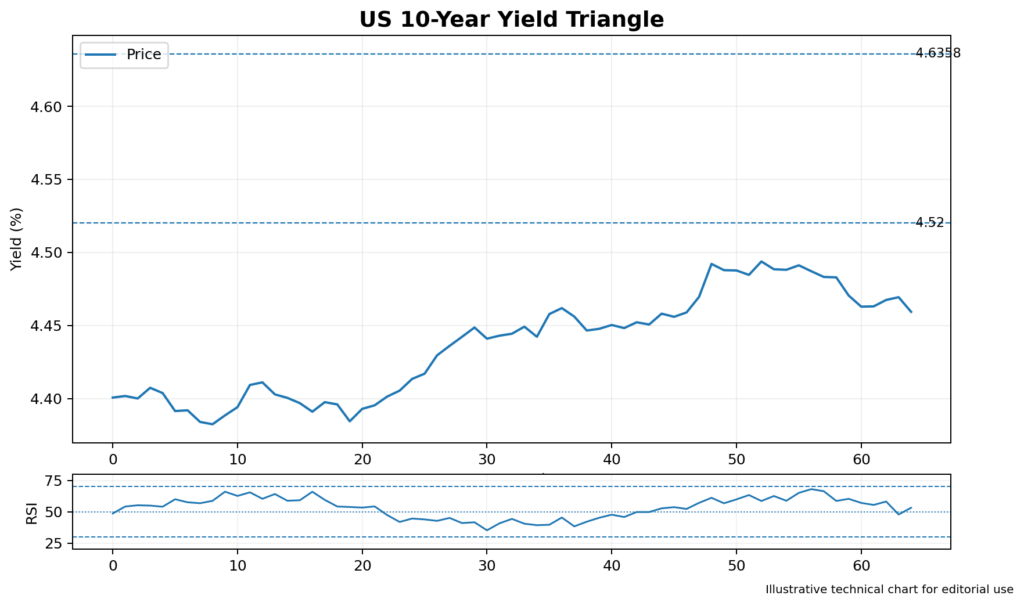
Image 1: US 10-Year Treasury Yield Daily Chart With the Symmetrical Triangle, 4.6358% Resistance and 4.52% Support
Bollinger BandWidth Reaches a Historic Low
Bollinger BandWidth measures the distance between the upper and lower Bollinger Bands. A falling reading indicates that volatility is contracting.
The monthly indicator recently reached its lowest level since 1989, showing that movements in the 10-year yield have become unusually compressed.
Periods of low volatility are often followed by stronger moves, but BandWidth does not reveal the eventual direction. Price action must provide confirmation.
If BandWidth begins expanding while the yield moves above 4.6358%, the technical picture would support an upside breakout. Expansion following a break below 4.52% would instead favour a bearish scenario.
Upside Levels Above 4.6358%
The first major resistance level is 4.6358%. A sustained move above this point could confirm that buyers have taken control of the narrowing pattern.
The next target may appear around 4.687%, which could attract some profit-taking. If yields remain firm above that level, attention may shift toward 4.81%.
Beyond 4.81%, the primary psychological target is 5.00%. A move toward this level could increase mortgage rates and corporate borrowing costs while placing pressure on rate-sensitive equities.
The main upside levels are therefore 4.6358%, 4.687%, 4.81%, and 5.00%.
Support Levels Below the Pattern
Initial support is positioned around 4.52%. A decline beneath this level could indicate that the attempted upside move has failed.
The next support area is located near 4.44%. More substantial protection appears around 4.29%, which represents an important boundary for the broader technical outlook.
A confirmed break below 4.29% could expose approximately 3.92%. Such a decline would probably require a meaningful shift in economic expectations, including weaker growth or stronger demand for government bonds.
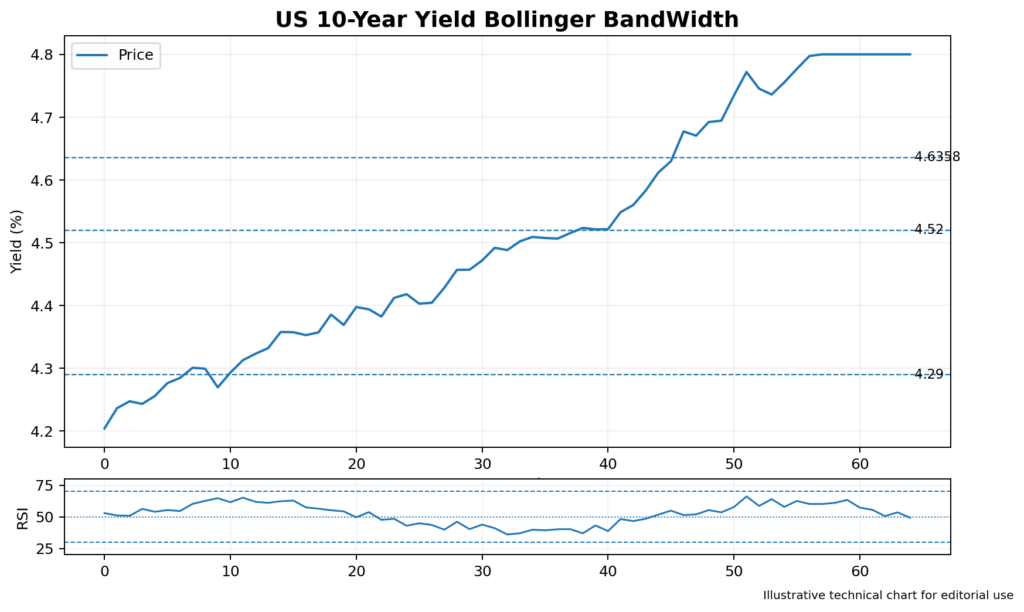
Image 2: US 10-Year Yield Weekly Chart With Bollinger Bands, Support at 4.29% and the 5.00% Upside Target
Cooling Inflation Pulls Yields Back
The yield retreated from its latest high after US inflation data came in below expectations.
Producer prices declined 0.3% from May to June, while consumer inflation also slowed. The figures reduced expectations that policymakers would need to raise interest rates immediately.
Lower inflation can support government bonds and push yields down because it reduces the perceived need for tighter monetary policy.
However, inflation remains above the preferred target. Higher energy prices could also feed into transport and production costs, making the outlook less straightforward.
This creates a balance between cooling recent data and the risk that price pressures return later in the year.
RSI and Moving-Average Signals
The Relative Strength Index may provide further confirmation as the yield tests the upper trend line.
An RSI reading above 50 would suggest that upward momentum remains intact. A move above 70 could show that the breakout is becoming stretched, while a decline below 50 would indicate weaker momentum.
Moving averages may also help confirm direction. If the 20-day Exponential Moving Average stays above the 50-day EMA, the medium-term structure remains constructive.
A bearish crossover would strengthen the possibility of a retreat toward lower support.
Trading Implications
A confirmed close above 4.6358% could place 4.687% and 4.81% in focus, with 5.00% representing the larger target.
A move below 4.52% would weaken the bullish case and expose 4.44%. A break beneath 4.29% would provide stronger evidence of a bearish resolution.
Because volatility is highly compressed, brief intraday moves may produce false signals. Confirmation through a daily or weekly close may therefore be particularly important.
Conclusion
The US 10-year Treasury yield is testing a significant technical area around 4.59% to 4.6358% while market volatility remains unusually low.
Resistance is positioned at 4.6358%, 4.687%, 4.81%, and 5.00%. Support can be found near 4.52%, 4.44%, 4.29%, and 3.92%.
The triangle and low Bollinger BandWidth reading suggest that the current period of limited movement may be approaching its end. Inflation data, energy costs, and interest-rate expectations are likely to determine which side of the pattern breaks first.