
European equities finished slightly higher on Wednesday as strength in luxury companies helped offset declines in technology and telecommunications shares. The STOXX 600 closed at 642.84, gaining 0.12% during the session while remaining only modestly higher for the week.
Brokers from AchievementsAI.com examine whether the index can move back toward 650 or whether uneven sector participation and continuing economic uncertainty could lead to further consolidation.
Technical Structure Remains Constructive
The STOXX 600 continues to trade above several important support areas despite losing some momentum since reaching a recent record high.
The 20-day Exponential Moving Average may provide the first layer of dynamic support. If the index remains above this indicator, the short-term structure could stay positive even if daily gains remain limited.
The 50-day EMA is more important for the medium-term outlook. Continued trading above this level would preserve the broader upward trend that developed during the first half of the year.
However, the index has struggled to produce a decisive breakout near higher resistance. This suggests that investors are becoming more selective rather than abandoning European shares.
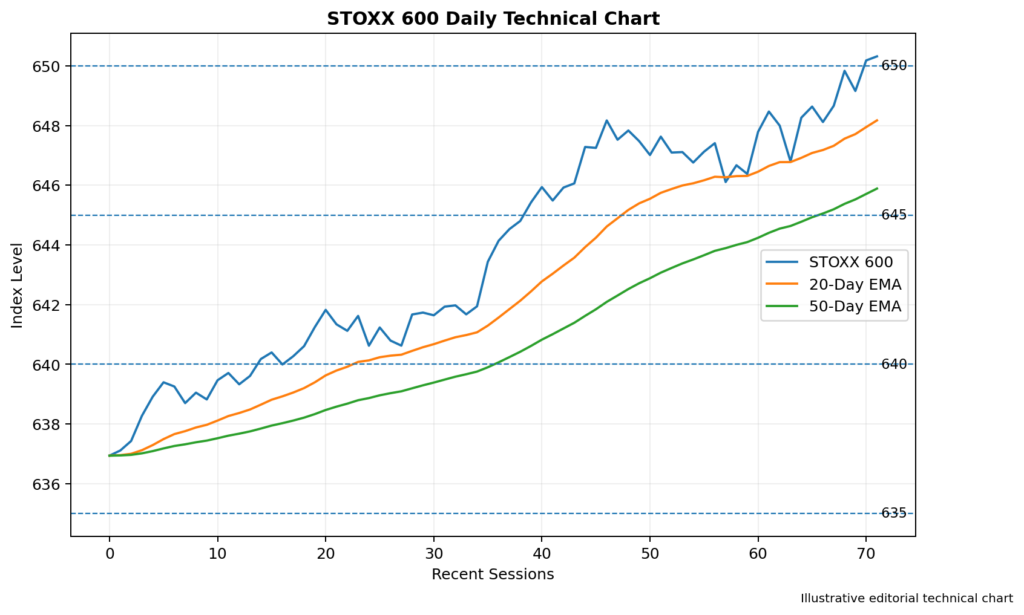
Image 1: STOXX 600 Daily Chart With the 20-Day and 50-Day EMAs, Support at 640 and Resistance Near 645
RSI Shows Balanced Momentum
The 14-day Relative Strength Index is likely to remain close to the neutral 50 level following the latest modest gain.
A sustained move above 50 would suggest that buying momentum is strengthening again. A rise toward 60 to 65 could support another attempt at recent highs without placing the index in clearly overbought territory.
If RSI falls below 50, the technical picture would become less positive. A decline toward 40 could indicate that sellers are gaining control of the short-term trend.
Traders may also monitor divergence. If the STOXX 600 records a higher price level while RSI forms a lower peak, the pattern could warn that the wider rally is losing momentum.
Resistance Levels Above 645
The first resistance area is located around 645. A move above this level would indicate that buyers are responding to the recent pause.
Stronger resistance may appear near 650, an important psychological barrier close to the region of recent record trading.
A confirmed break above 650 could expose approximately 652 to 653, near the index’s earlier intraday peak.
Beyond that area, the next target may emerge around 655. Reaching this level would probably require broader participation from technology, industrial, financial, and consumer shares.
The main resistance levels are 645, 650, 652 to 653, and 655.
Support and Pullback Risk
Immediate support is positioned around 640. This level may determine whether the latest pause remains a controlled consolidation.
A sustained break below 640 could expose 635, an area linked to earlier July trading and a previous market decline.
Further weakness may bring 630 into focus. A move below this level would represent a more significant deterioration in the short-term structure and could place the 50-day EMA under pressure.
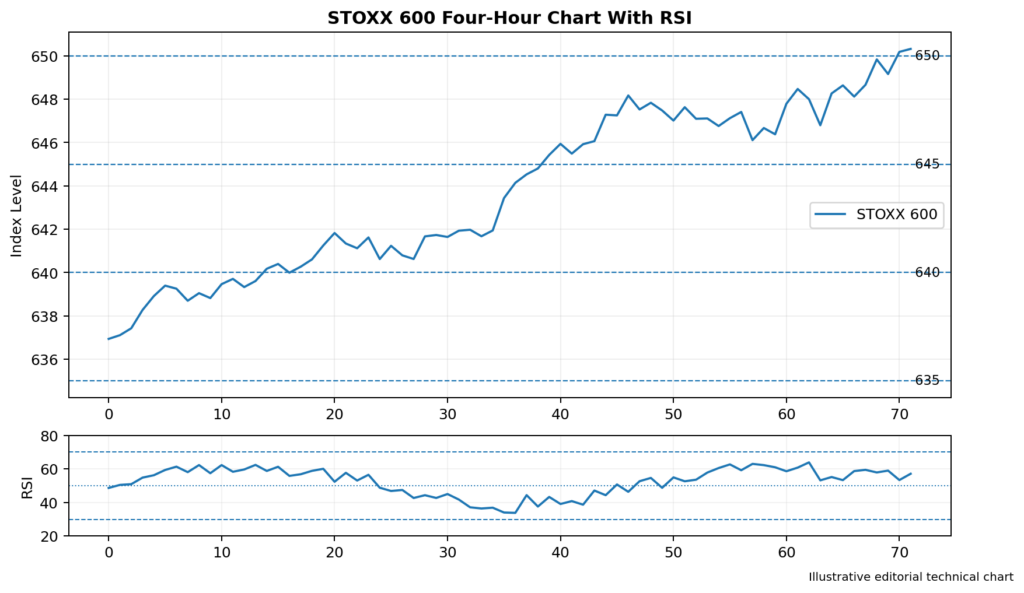
Image 2: STOXX 600 Four-Hour Chart With RSI, Support at 640 and 635, and Resistance at 645 and 650
Luxury Shares Support the Index
Luxury companies provided much of Wednesday’s support. Richemont gained 6.68% after reporting stronger first-quarter results, with demand remaining firm across Asia and the Americas.
The move helped offset weakness in several other sectors. Technology shares declined 0.53%, while telecommunications companies also finished lower. Germany’s DAX fell 0.59%, showing that the broader European market remained uneven.
This mixed performance matters because sustainable index gains normally require participation from more than one sector. Continued strength in luxury shares may support the STOXX 600, but a clearer breakout could depend on technology and industrial companies recovering.
Earnings and Inflation Shape Sentiment
Corporate earnings are increasingly influencing European markets. Investors are looking for evidence that companies can maintain revenue growth despite higher energy costs and slower activity in parts of the global economy.
ASML raised its full-year sales forecast but still declined 0.41%, suggesting that strong results may already be reflected in some technology valuations.
Softer US inflation data recently reduced expectations of an immediate rate increase and supported equities worldwide.
However, higher oil prices remain a risk for European companies and consumers. Energy-intensive businesses may face rising costs, while renewed inflation pressure could limit the ability of central banks to adopt a more supportive policy stance.
Trading Implications
The STOXX 600 retains a cautiously constructive bias while trading above 640 and its main moving averages.
A confirmed move through 645 could expose 650 and the recent high near 652 to 653. Stronger RSI readings and broader sector participation would support that scenario.
A break below 640 would weaken the immediate outlook and shift attention toward 635. A sustained move below 630 would suggest that the recent consolidation is developing into a deeper correction.
Conclusion
The STOXX 600 remains close to 643 after luxury shares helped offset weakness elsewhere in the market.
Resistance is positioned at 645, 650, 652 to 653, and 655. Support can be found near 640, 635, and 630.
The technical structure remains positive above the main moving averages, but market participation is uneven. A stronger breakout will likely require support from technology and industrial shares alongside continued resilience in consumer and luxury companies.