
Bitcoin moved higher during Wednesday’s session after softer US inflation data reduced expectations of an immediate interest-rate increase. The cryptocurrency climbed toward $64,700, extending its recovery from the lower end of its recent trading range.
Brokers from AchievementsAI.com examine whether Bitcoin can build on the rebound and move toward $67,000, or whether mixed institutional demand and wider market uncertainty could limit the advance.
Technical Structure Improves Above $64,000
Bitcoin’s return above $64,000 has improved the short-term chart. This level acted as resistance during several earlier recovery attempts, so remaining above it could help establish a stronger base.
The 20-day Exponential Moving Average is the first technical indicator to monitor. A sustained close above it would suggest that near-term momentum is turning more positive.
The 50-day EMA remains more important for the broader outlook. Bitcoin has struggled to maintain recoveries above major moving averages during parts of 2026, making this indicator a significant test for buyers. Reuters previously identified the 30-day and 200-day moving averages as major barriers during an earlier recovery attempt.
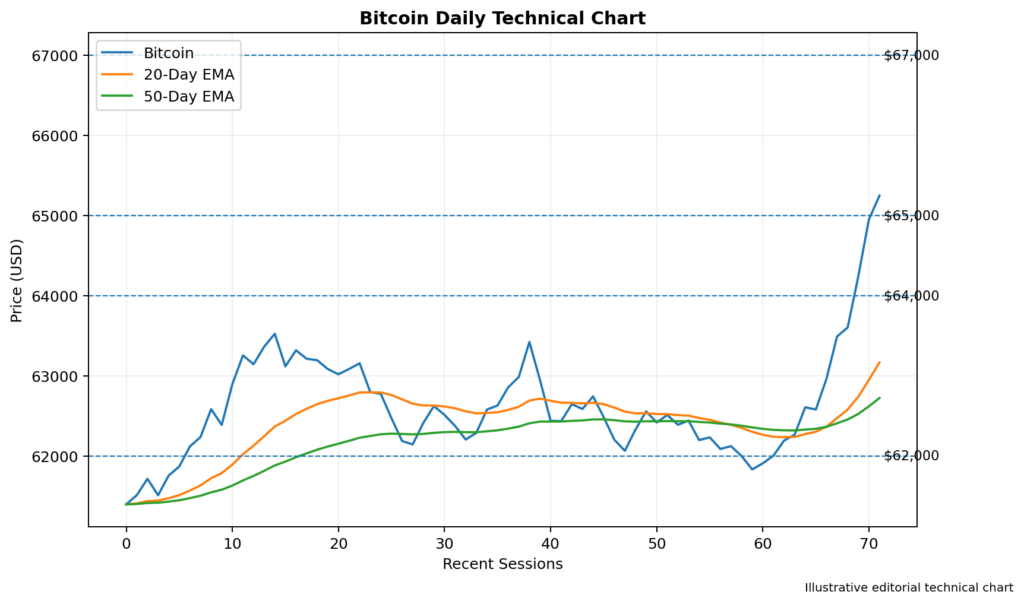
Image 1: Bitcoin Daily Chart With the 20-Day and 50-Day EMAs, Support at $64,000 and Resistance Near $65,000
RSI Shows Momentum Is Strengthening
The 14-day Relative Strength Index has moved higher as Bitcoin recovered. A reading above the neutral 50 level would indicate that buying momentum is beginning to outweigh selling pressure.
An RSI move toward 60 to 65 could support further gains without placing the market in clearly overbought territory.
A rise above 70 would signal that the rebound is becoming stretched. This would not automatically end the advance, but it could increase the likelihood of profit-taking near resistance.
Traders may also watch for bearish divergence. If Bitcoin records a higher price high while RSI produces a lower peak, the pattern could suggest that momentum is weakening.
Resistance Levels Above $65,000
The first important resistance area is positioned around $65,000. Bitcoin recently approached this level after the inflation-driven rebound, making it the immediate test for buyers.
A confirmed daily close above $65,000 could open the way toward $67,000. This level may attract additional selling orders because it represents the next significant round-number barrier.
If Bitcoin clears $67,000, the market could target approximately $70,000. This psychological level may become more difficult to break because it previously acted as a major reference point during the 2026 selloff.
The main resistance levels are $65,000, $67,000, and $70,000.
Support Levels and Pullback Risk
Immediate support is located around $64,000. Holding above this level would preserve the latest recovery structure.
A move below $64,000 could expose $62,000, an area close to recent trading levels. Bitcoin was priced near $62,666 on July 9, showing that buyers previously entered the market around this region.
Further weakness could bring $60,000 back into focus. This remains a major psychological support level and an important boundary for the wider market outlook.
A sustained break below $60,000 would weaken the recovery and increase the risk of another decline toward earlier 2026 lows.
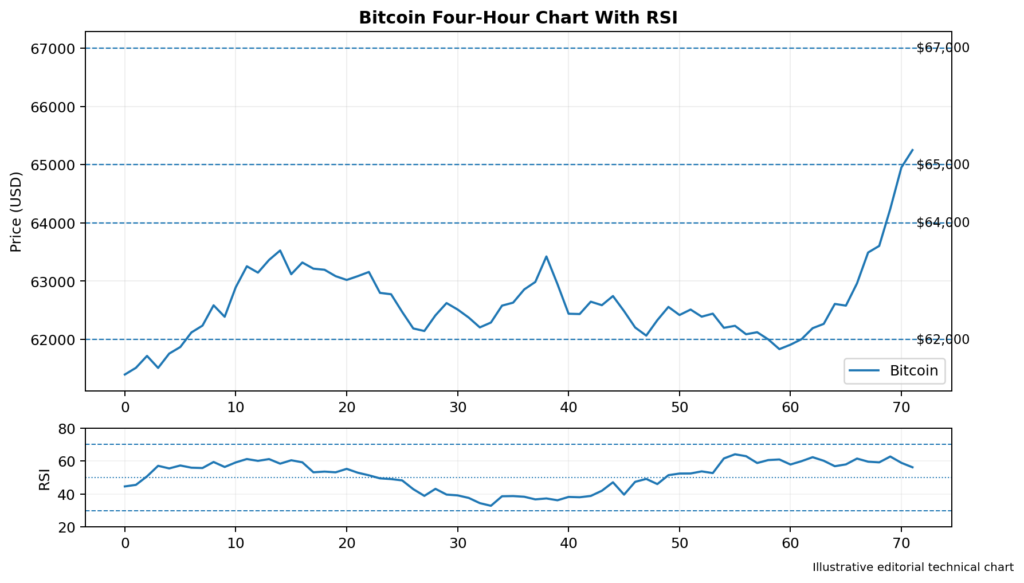
Image 2: Bitcoin Four-Hour Chart With RSI, Support at $64,000 and $62,000, and Resistance at $65,000 and $67,000
Softer Inflation Supports Risk Assets
Bitcoin’s rebound followed weaker-than-expected US inflation data. Producer prices declined 0.3% in June, while earlier consumer inflation figures also reduced expectations of an immediate rate increase.
Lower interest-rate expectations can support Bitcoin and other risk assets because they reduce pressure from rising bond yields and improve demand for investments that do not generate fixed income.
The softer figures also weakened the US dollar, which can provide additional support for dollar-denominated cryptocurrencies.
However, the outlook remains mixed. Energy prices and geopolitical uncertainty could still influence inflation expectations, bond yields, and general risk appetite.
Institutional Demand Remains Uneven
Bitcoin’s 2026 performance has also been affected by changing institutional flows.
Digital asset treasury companies have struggled to recover their earlier valuations, while several major corporate Bitcoin holders have experienced pressure as cryptocurrency prices remained below previous peaks.
Exchange-traded fund flows have also been inconsistent. Recent data showed periods of substantial outflows followed by more limited inflows, suggesting that institutional confidence remains fragile rather than fully restored.
This may limit the strength of rallies unless demand becomes more consistent.
Trading Implications
Bitcoin maintains a cautiously bullish bias while trading above $64,000.
A confirmed break above $65,000 could expose $67,000 and potentially $70,000. Stronger RSI readings and continued closes above the 20-day EMA would support that scenario.
A rejection near $65,000 could lead to another test of $64,000 or $62,000. A sustained break below $60,000 would significantly weaken the technical outlook.
Conclusion
Bitcoin has recovered toward $64,700 as softer inflation data improved demand for risk assets.
Resistance is positioned at $65,000, $67,000, and $70,000. Support can be found around $64,000, $62,000, and $60,000.
The technical picture has improved, but buyers still need a confirmed close above $65,000. Until that happens, Bitcoin remains in a developing recovery rather than a fully established bullish breakout.