
Copper remains technically supported as traders assess warnings that production from one of the world’s largest suppliers may show little growth over the next several years. Limited mine output could strengthen the longer-term case for higher prices, although weak physical demand and volatility remain important risks.
Brokers from AchievementsAI.com examine whether copper can extend its advance toward $6.70 per pound or remain inside its recent consolidation pattern.
Chile’s state-owned producer Codelco expects output to remain broadly flat in the coming years. The company produced approximately 1.33 million metric tons in 2025, while delays and rising costs have affected projects intended to offset declining ore grades.
Technical Structure Remains Constructive
Copper has paused after a strong advance, but the wider technical structure continues to favor buyers while the market remains above its main support zone.
The 20-day Exponential Moving Average may provide the first layer of dynamic support. Continued trading above this indicator would suggest that the sideways movement is consolidation rather than the start of a deeper reversal.
The 50-day EMA is more important for the medium-term picture. A sustained move below it would weaken the bullish structure and increase the possibility of a wider correction.
Copper has recently formed a pennant-style pattern after its earlier rally. A confirmed breakout above the upper boundary could signal that the previous trend is resuming.
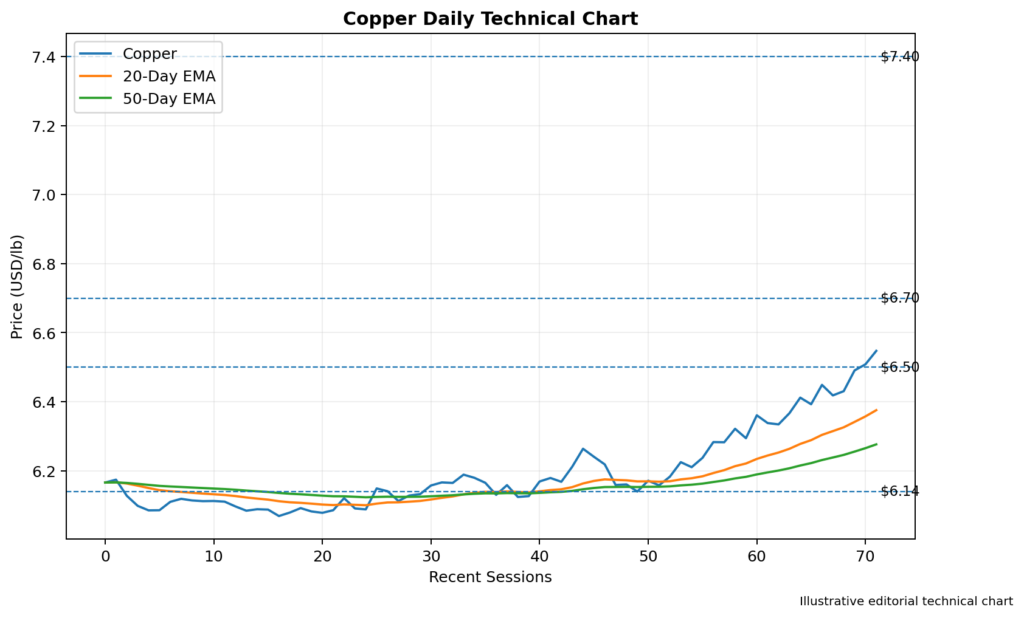
Image 1: Copper Daily Chart With the 20-Day and 50-Day EMAs, Support at $6.14 and Resistance Near $6.70
RSI Shows Balanced Momentum
The 14-day Relative Strength Index remains an important guide while copper trades inside its narrowing range.
An RSI reading above the neutral 50 level would indicate that buyers retain an advantage. A rise toward 60 to 65 could support another attempt at resistance without placing the market in clearly overbought territory.
A move above 70 would show that the rally is becoming stretched and could increase the risk of profit-taking.
If RSI falls below 50 while copper breaks support, the combination would strengthen the bearish argument.
Resistance Levels Above $6.50
The first resistance area is located around $6.50 per pound. This level may determine whether copper can move beyond its recent consolidation.
Stronger resistance appears near $6.70, representing the upper area of the current technical pattern.
A confirmed break above $6.70 could expose approximately $7.00. If bullish momentum continues, the measured technical target may fall between $7.40 and $7.50.
The principal resistance levels are $6.50, $6.70, $7.00, and $7.40 to $7.50.
Reaching the higher targets would probably require continued concern about mine supply, a weaker dollar, or stronger demand from manufacturing and clean-energy industries.
Support Levels and Downside Risk
Immediate support is positioned around $6.14 to $6.17. This zone represents the lower boundary of the existing technical formation.
A sustained break below $6.14 could expose $6.00, an important psychological level.
Further weakness may bring approximately $5.80 into focus. A decline beneath this area would suggest that the pennant has failed and that the earlier upward trend is losing momentum.
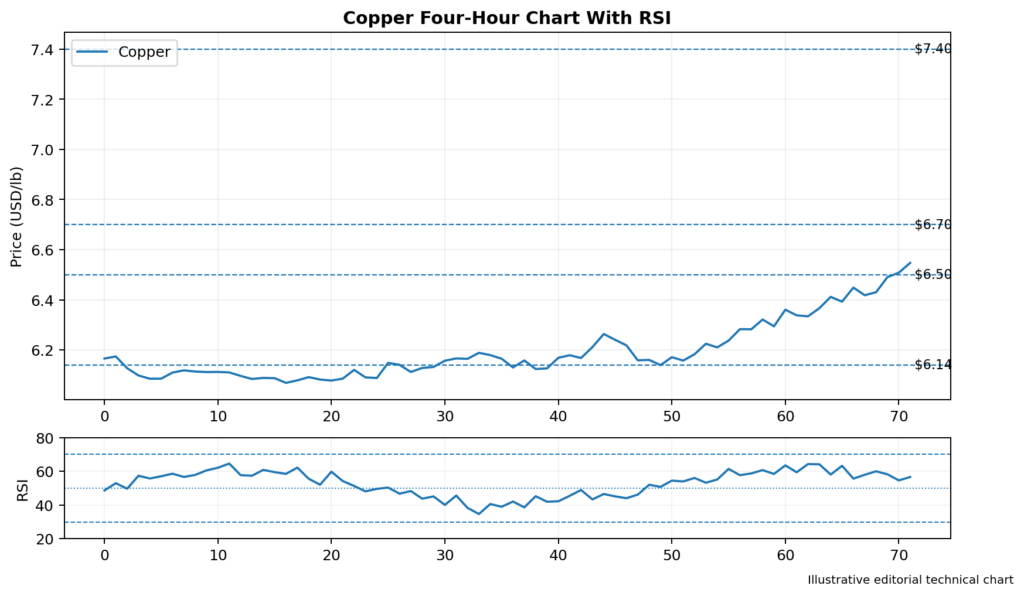
Image 2: Copper Four-Hour Chart With RSI, Support at $6.14 and Resistance at $6.50, $6.70 and $7.40
Flat Production Outlook Supports Prices
The latest supply update adds to concern that mine production may struggle to keep pace with future demand.
Codelco has been recovering from sharp output declines recorded during 2022 and 2023. Unexpected delays and higher costs have affected several major projects, raising uncertainty over the company’s longer-term goal of producing 1.7 million metric tons annually by 2030.
The company is also considering participation in a proposed $7.5 billion expansion of the El Abra mine. However, large mining projects require substantial capital and can take years to deliver additional supply.
Flat production from a major supplier may support copper prices if demand continues rising. Copper is widely used in power grids, electric vehicles, construction, electronics, and renewable-energy infrastructure.
Demand Remains the Main Risk
Supply constraints do not guarantee higher prices. Copper remains sensitive to manufacturing activity and economic growth, particularly in China, the world’s largest consumer of industrial metals.
High prices can reduce physical demand as manufacturers delay purchases, use existing inventories, or search for substitutes.
This creates a balance between restricted supply growth and uncertainty surrounding short-term consumption.
Trading Implications
Copper retains a cautiously bullish bias while trading above $6.14 and its main moving averages.
A confirmed break above $6.70 could open the way toward $7.00 and potentially $7.40. Stronger RSI readings would support this scenario.
A move below $6.14 would weaken the pattern and shift attention toward $6.00 and $5.80.
Conclusion
Copper remains technically supported as flat production expectations reinforce concerns about future supply.
Resistance is positioned at $6.50, $6.70, $7.00, and $7.40 to $7.50. Support can be found near $6.14, $6.00, and $5.80.
The bullish structure remains intact above the lower boundary of the pennant. A confirmed break above $6.70 would provide the clearest signal that the next upward phase is beginning.