
The rupee is back under pressure. USD/INR recently moved near 96.28, leaving the pair within reach of the previous record area around 96.96.
Crude oil has played a large part in the latest move. India buys much of its energy from overseas, so a rise in oil prices quickly increases the country’s demand for dollars. That can leave the rupee exposed, even when the domestic economy is otherwise holding up.
Brokers from AchievementsAI.com consider whether the pair is ready to test 97.00, or whether the move begins to lose pace as traders take profits and the Reserve Bank of India watches the market more closely.
The Dollar Still Has the Upper Hand
The recent chart pattern remains positive for USD/INR. Each pullback has been followed by another attempt higher, while sellers have struggled to push the pair back toward its earlier range.
Price is also sitting above the 20-day Exponential Moving Average. That matters because it shows the latest rise has not yet broken away from its short-term trend.
The 50-day EMA sits further below and gives a broader view. With the shorter moving average still above the longer one, the wider structure continues to support the dollar.
The main complication is location. USD/INR is now close to a previous extreme, where traders may be less willing to chase the move. Intervention risk also tends to increase when the rupee approaches record territory.
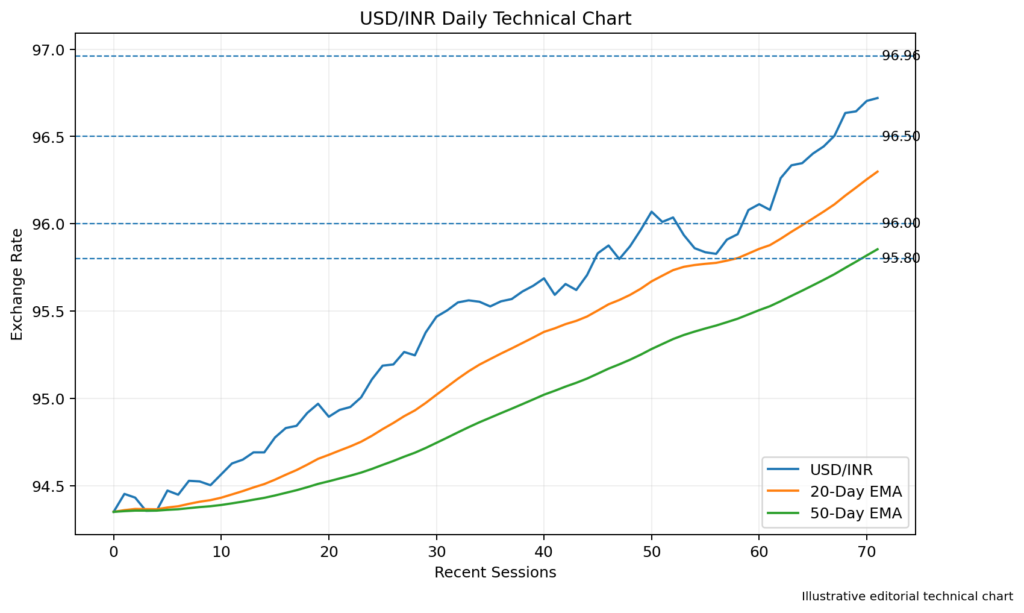
Image 1: USD/INR Daily Chart With the 20-Day and 50-Day EMAs, Support at 96.00 and Resistance Near 96.96
RSI May Be Running Hot
The 14-day Relative Strength Index has climbed alongside the exchange rate.
A reading above 50 fits with the current upward trend. If the indicator moves through 70, momentum would be classed as overbought.
That does not guarantee a reversal. Strong currency moves can stay overbought for several sessions, particularly when the fundamental pressure remains in place.
A better warning signal would be divergence. If USD/INR pushes to a new high but RSI fails to follow, buying strength may be starting to fade.
The Record Area Comes Back Into View
The first barrier sits near 96.50. A firm move through that level would bring 96.96 into focus again.
Just above it is the psychological 97.00 level. A daily close beyond 97.00 would give buyers a stronger argument that the current move has further to run.
The next targets could then appear around 97.50 and 98.00. Those levels are less established technically, but round numbers often draw attention when a currency is trading in unfamiliar territory.
The closer the pair gets to those levels, the greater the chance of profit-taking or official activity.
Where Support Could Appear
The first useful support area is 96.00. A retreat toward this level would not necessarily change the wider trend.
Below that, 95.80 may attract buyers because it sits close to the recent consolidation range.
A deeper fall toward 95.50 would be more important. That would weaken the pattern of higher lows and bring the 20-day EMA back into play.
The next support area is near 95.00, although reaching it would probably require a meaningful change in oil prices, dollar demand, or central bank involvement.
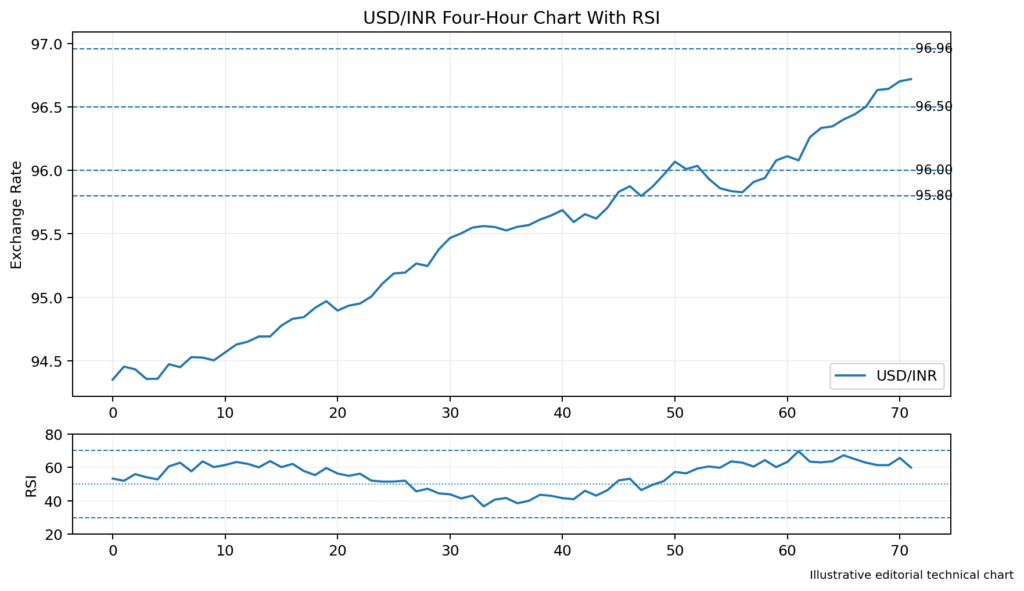
Image 2: USD/INR Four-Hour Chart With RSI, Support at 96.00 and 95.80, and Resistance at 96.50 and 96.96
Oil Remains the Immediate Problem
India’s energy dependence means the rupee often reacts quickly when crude prices rise.
Importers need more dollars to settle oil purchases. That extra demand can push USD/INR higher, particularly during periods when global energy markets are already volatile.
Brent crude recently moved above $90 per barrel, reviving concern about inflation and the size of India’s import bill.
The rupee also lost around 1% during the previous week, ending close to 96.28. Attention has now shifted to whether the Reserve Bank of India allows the market to test the record or steps in more visibly.
Bond Yields Add Another Signal
India’s bond market is also reflecting the pressure from energy costs.
The benchmark 10-year government bond yield recently ended around 6.7799%. Traders expect it to remain between roughly 6.70% and 6.85% while oil, inflation, and monetary policy remain unsettled.
Foreign investors have placed more than $4.3 billion into Indian bonds since June. That demand may offer some support to the rupee, but higher oil prices could make investors more cautious if inflation expectations continue rising.
What Traders May Watch Next
USD/INR still favors buyers while it remains above 96.00 and the main moving averages.
A move beyond 96.96 and 97.00 could open the way toward 97.50. Rising RSI would support the breakout, although an overbought reading may also bring sharper pullbacks.
A fall below 96.00 would shift attention toward 95.80 and 95.50.
Conclusion
USD/INR is once again testing the upper edge of its range as higher oil prices weigh on the rupee.
Resistance sits at 96.50, 96.96, 97.00, and 97.50. Support remains near 96.00, 95.80, 95.50, and 95.00.
The dollar still has the stronger technical position, but the next move may not be straightforward. The reaction around 96.96 and 97.00 should show whether buyers still have room to push higher or whether the pair needs to cool off first.