
The S&P 500 remained close to 7,500 after a quiet Wednesday session in which rising oil prices, higher Treasury yields, and mixed technology earnings limited risk appetite. The index slipped 0.1% to 7,498.96, while the Nasdaq Composite fell 0.6%.
This analysis from Lucovox.com examines whether the S&P 500 can recover above 7,500 or whether inflation concerns and weaker technology momentum could push the index toward lower support.
Oil Prices Create a New Inflation Risk
Brent crude moved above $94 and later climbed beyond $98 as tensions in the Middle East disrupted shipping and raised concerns about energy supplies.
Higher oil prices can increase transportation, manufacturing, and consumer costs. That may slow progress on inflation and give the Federal Reserve less room to lower rates.
The main risk for equities is that persistent energy inflation keeps borrowing costs elevated for longer.
This would pressure rate-sensitive sectors and companies with high valuations based on future earnings.
The Daily Trend Remains Constructive
The S&P 500 continues to trade above its 20-day and 50-day Exponential Moving Averages.
Holding above the 20-day EMA would preserve the short-term bullish structure.
As long as the index remains above both averages, moderate pullbacks may continue to attract buyers.
A sustained move beneath the 20-day EMA would warn that momentum is weakening.
A break below the 50-day EMA would increase the risk of a wider correction.
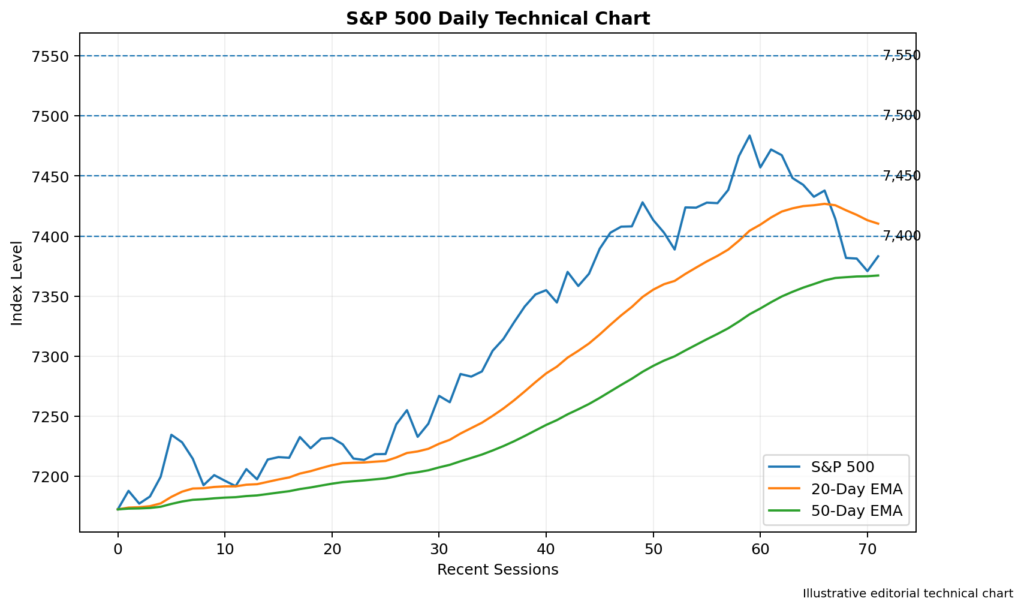
Image 1: S&P 500 Daily Chart With the 20-Day and 50-Day EMAs, Support at 7,400 and Resistance Near 7,500
RSI Shows Momentum Has Cooled
The 14-day Relative Strength Index has weakened as the market struggled to extend its advance.
A reading above 50 would show that buyers still hold the broader momentum advantage.
A move below 50 would suggest that sellers are gaining control of the short-term picture.
If RSI approaches 30, the index would move toward oversold territory and could attract bargain buying.
Resistance Remains Near 7,500
The first major barrier is positioned around 7,500.
The index has traded close to this level without establishing a convincing break above it.
A daily close above 7,500 could bring 7,550 into focus, followed by 7,600.
A sustained move above 7,550 would provide stronger evidence that buyers are regaining control.
Further gains may depend on better earnings guidance, lower oil prices, and falling Treasury yields.
Support Begins Near 7,450
The first support area sits around 7,450.
A break below this level could expose 7,400, where buyers may attempt to defend the broader advance.
Further weakness may bring 7,350 into view.
A sustained break below 7,400 would weaken the near-term structure and increase the risk of a deeper pullback.

Image 2: S&P 500 Four-Hour Chart With RSI, Support at 7,450 and 7,400, and Resistance at 7,500 and 7,550
Technology Earnings Produce Mixed Signals
Technology earnings remain important because large growth companies carry significant weight in the S&P 500.
Recent results showed strong demand in some cloud and artificial-intelligence businesses, but investors also focused on rising capital spending and pressure on margins.
Investors increasingly want proof that higher AI spending will produce stronger profits.
This could create wider differences between technology companies rather than lifting the entire sector.
Earnings Expectations Remain High
The broader earnings outlook is still supportive, with forward estimates improving during 2026.
However, stronger expectations also raise the performance bar.
Companies may need to deliver both solid earnings and confident guidance to justify current valuations.
Any sign that labor, energy, or investment costs are reducing margins could trigger sharper reactions.
Treasury Yields Add Pressure
The two-year Treasury yield recently rose to around 4.3%, its highest level since February 2025.
Higher yields can reduce the appeal of expensive growth stocks and make government bonds more competitive with equities.
A continued rise in short-term yields would create another obstacle for the S&P 500 near record territory.
Lower oil prices or softer economic data could ease that pressure.
Market Breadth Remains Important
Smaller companies weakened more sharply, with the Russell 2000 falling 0.9% while the S&P 500 moved only slightly lower.
This suggests that investors remain more comfortable holding large companies with stronger balance sheets.
A healthier rally would normally include better participation from smaller companies and economically sensitive sectors.
Without broader support, the index may remain dependent on a limited number of large stocks.
Trading Implications
The S&P 500 keeps a cautiously bullish outlook while trading above 7,400 and its main moving averages.
A confirmed break above 7,500 could expose 7,550 and 7,600.
A move below 7,450 would weaken immediate momentum, while a sustained break beneath 7,400 could shift attention toward 7,350.
Conclusion
The S&P 500 remains close to 7,500 as investors balance strong profit expectations against rising oil prices, higher yields, and mixed technology earnings.
Resistance is positioned near 7,500, 7,550, and 7,600. Support can be found around 7,450, 7,400, and 7,350.
The broader trend still favors buyers, but the index may struggle to extend its rally unless inflation concerns ease and technology earnings provide clearer support.