
Copper remained firm near $13,600 per metric ton as stronger Chinese import demand and falling exchange inventories supported the market. Benchmark three-month copper recently traded around $13,633 per metric ton, extending a recovery driven by tighter supply.
This analysis from Lucovox.com examines whether copper can break above $13,750 or whether weaker growth, high prices, and tariff uncertainty could interrupt the advance.
Chinese Imports Strengthen the Market
Refined copper imports in China reached a high in June. This was the result of smelter maintenance reducing domestic production.
The Yangshan copper premium climbed to $100 per ton, its highest level in 14 months and a rise of 133% since the start of the year.
Stronger import premiums suggest that Chinese buyers are willing to pay more to secure physical copper.
China remains the world’s largest consumer of the metal. Continued import growth could support prices even while manufacturing and construction data remain uneven.
The Daily Trend Remains Constructive
Copper is trading above its 20-day and 50-day Exponential Moving Averages.
Holding above the 20-day EMA would keep the short-term bullish structure intact.
As long as the price remains above both averages, pullbacks may continue to attract buyers.
A sustained move beneath the 20-day EMA would warn that momentum is weakening. A break below the 50-day EMA would increase the risk of a deeper correction.
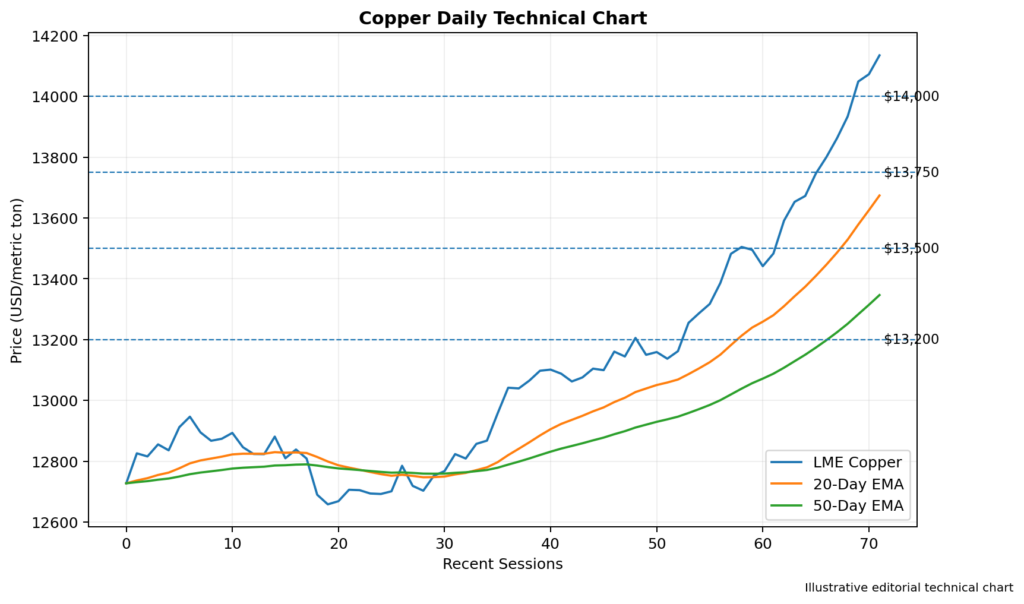
Image 1: Copper Daily Chart With the 20-Day and 50-Day EMAs, Support at $13,200 and Resistance Near $13,750
RSI Shows Positive Momentum
The 14-day Relative Strength Index has strengthened alongside the copper price.
A reading above 50 would confirm that buyers retain the momentum advantage.
A move toward 60 or 65 could support another test of resistance without placing the market in clearly overbought territory.
If RSI climbs above 70, copper may become vulnerable to profit-taking. Traders may also watch for bearish divergence if the price rises while the RSI falls.
Resistance Appears Near $13,750
The first resistance area sits around $13,750.
A clear break above this level could expose the psychological $14,000 mark. Further gains may bring $14,250 into focus, followed by the record region around $14,500.
A daily close above $14,000 would confirm that the recovery is developing into a wider breakout.
Reaching those levels would likely require continued Chinese buying and further inventory declines.
Support Begins Near $13,500
The first support area is positioned around $13,500.
A move below this level could expose $13,200, where the short-term moving averages may provide additional support.
Further weakness may bring $13,000 into view.
A sustained break below $13,000 would weaken the recovery and suggest that demand concerns are starting to outweigh tight supply.

Image 2: Copper Four-Hour Chart With RSI, Support at $13,500 and $13,200, and Resistance at $13,750 and $14,000
Exchange Inventories Continue to Fall
Available copper stocks have declined across major exchanges.
Shanghai Futures Exchange inventories recently fell to 79,909 metric tons, more than 80% below their mid-March level. LME stocks also dropped sharply, with more than half already earmarked for delivery.
Falling available inventories increase the risk of short-term supply tightness.
When warehouse metal is reserved for withdrawal, buyers may need to compete more aggressively for what remains.
Producers Benefit From Higher Prices
Teck Resources reported that its realized copper price rose to $6.05 per pound from $4.32 a year earlier. Production also increased 24.6% to 135,900 metric tons.
The company’s adjusted earnings exceeded expectations, showing how higher prices can improve profitability.
Stronger mining earnings may encourage investment, but additional supply usually takes years to reach the market.
New projects face long approval processes and high costs, limiting how quickly producers can respond.
Tariff Expectations Create Distortions
Possible future US tariffs have encouraged traders to redirect copper toward American warehouses.
This has tightened supply outside the United States and contributed to falling inventories in China and London.
A delay or reduction in proposed tariffs could reverse some warehouse flows.
Tariff uncertainty may support prices while increasing volatility between regional markets.
Long-Term Demand Remains Supportive
Copper demand is expected to benefit from power-grid investment, electric vehicles, renewable energy, defense spending, and data-center construction.
Industry estimates suggest global demand could rise 50% by 2040.
Electrification remains one of the strongest long-term arguments for higher copper demand.
However, copper is still sensitive to manufacturing and construction activity. A slowdown in major economies could trigger sharp corrections, while high prices may encourage buyers to delay purchases.
Trading Implications
Copper retains a bullish short-term bias while trading above $13,500 and its main moving averages.
A confirmed break above $13,750 could expose $14,000 and $14,250.
A move below $13,500 would weaken immediate momentum, while a sustained break beneath $13,200 could shift attention toward $13,000.
Conclusion
Copper remains supported by stronger Chinese imports, falling exchange inventories, and solid producer earnings.
Resistance is positioned near $13,750, $14,000, and $14,250. Support can be found around $13,500, $13,200, and $13,000.
The technical trend continues to favor buyers, but tariff uncertainty and weaker global growth could still produce sharp consolidation.