
The research team at Risance examines Meta Platforms, whose shares gained about 5% on Monday and moved back over an important long-term trend line. The stock closed the session near $641, and investors now want to know whether the advance has enough strength to continue.
A Strong Monday Session
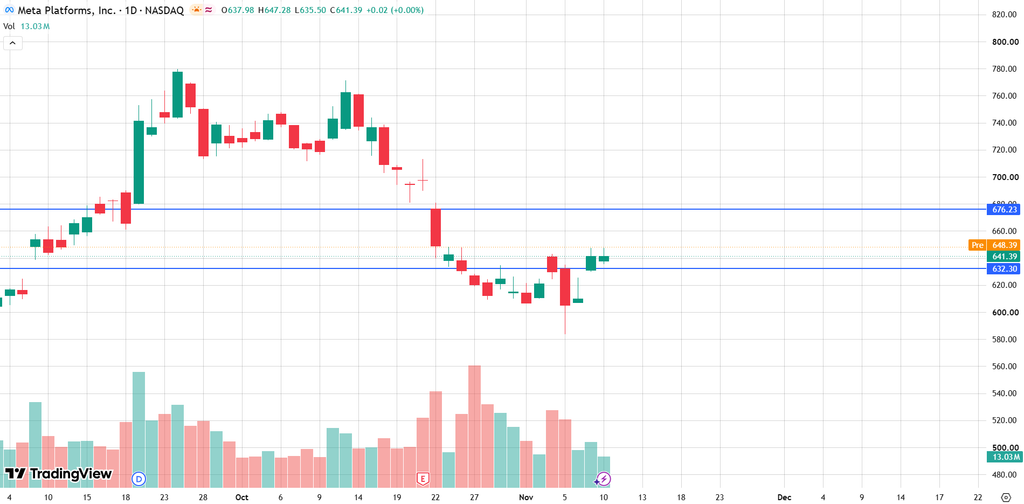
On Monday, META climbed as high as $647.25 and last traded near $641.37, with more than 19 million shares changing hands. The rise, about 5.1%, was a large move for a company of this size, and it pushed the price above its 200-day moving average, which stands near $632.30.
This average is closely followed by institutions, because it separates long-term strength from long-term weakness. A move above it suggests that the stock is regaining some of the ground lost in the previous period, even though the 50-day average, near $676.23, remains clearly higher.
The distance from the 50-day average is also worth noticing. When the shorter average sits above the longer one and the price is between them, the market is usually in a recovery phase that has not yet become a clear uptrend. Buyers still need to show that they can push the price through the next barriers.
What Lifted The Shares
Several pieces of news supported the rally. First, a major investment bank added Meta to its list of preferred internet stocks, pointing to the strength of advertising powered by artificial intelligence and to possible new ways of earning money from the technology. Such endorsements can attract new buyers, and this one helped lift the price.
Second, the company released a new AI model called Muse Ember. It is light, cost-efficient and designed for agent tasks such as writing code and processing documents. Investors may see it as proof that Meta can expand its AI abilities without raising costs too much.
A third item had a more neutral tone. The company is extending globally a tool that estimates the age of Instagram users, in order to identify teenagers and apply protections to their accounts. The step may help to address safety concerns, although it arrives while the company faces legal pressure on the subject.
Strong Results Still Support The Story
The latest quarterly report, published on October 22, gave the bullish case a solid base. Earnings per share reached $7.40, well above the market estimate of $6.54, and revenue came in at $64.6 billion, compared with expectations of about $63.3 billion. Sales grew by 26.1% from the same period of last year, and the net margin was above 31%.
With a market value of about $1.64 trillion and a price-to-earnings ratio near 22, the stock does not look expensive compared with its growth. Its beta of 1.28 also shows that it tends to move more than the broader market, which explains why it can rise and fall quickly.
The Concern About AI Spending
Not everyone is comfortable. One recent analysis pointed out that free cash flow turned negative in the last quarter, because of the very high amount of money being spent on artificial intelligence. If the technology does not generate revenue as fast as costs rise, returns could suffer.
This tension explains why the stock reacts so strongly to any news about AI. Good news can lead to sharp rallies, while doubts about spending can produce equally sharp declines.
Support And Resistance Levels
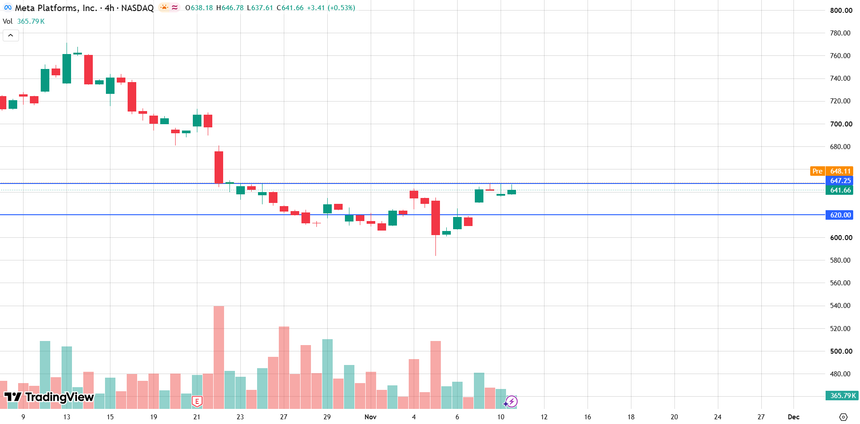
On the upside, the first resistance is the Monday high at $647.25, followed by the round number of $650. A close above that area would open the way toward the 50-day average near $676.23, which is the next major target, and then $700.
On the downside, the first support is the 200-day average near $632.30. A drop under it would cancel Monday’s breakout, with $620 as the next level to watch and $600 as a deeper floor.
What Traders Can Do
After a gain of more than 5% in one day, some consolidation would be normal. Buyers may wait for the price to hold above $632.30 or to close over $647.25, and then aim for $676.23, placing a stop-loss under the 200-day average to limit the risk.
Sellers may look for a daily close under $632.30, which would show that the breakout has failed, and then target $620. Because the stock reacts strongly to news about AI, position size should stay moderate, and a stop-loss should always be set before entering. Watching volume on any new breakout can also help, since a rise on strong volume is usually more reliable than one on thin trading.
Conclusion
Meta Platforms has moved above its 200-day moving average thanks to a strong report, new AI products and a positive view from a major bank, while worries about spending remain in the background. The $647.25 high and the $632.30 average are the levels to follow.
Traders following Stocks strategies should watch AI news, market sentiment and the reaction at these levels, since these factors are likely to guide the next move in Meta.