
Copper has given back its early-week gains, and the short-term picture now depends on a few price areas that sit very close together. The analysts at Risance study the metal, which peaked at $6.396 per pound on Tuesday before sliding, and they look at what could happen if sellers keep control.
Where Copper Stands Now
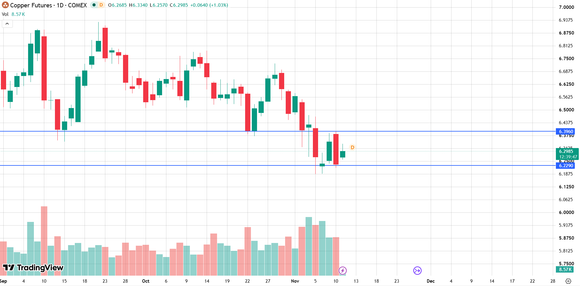
After starting Tuesday with a gain, the price ran up to $6.396, then reversed and slipped beneath the lower line of a downward-sloping channel that it had only just recovered. This is a setback for buyers, because the move on Monday had given the impression that the correction was ending.
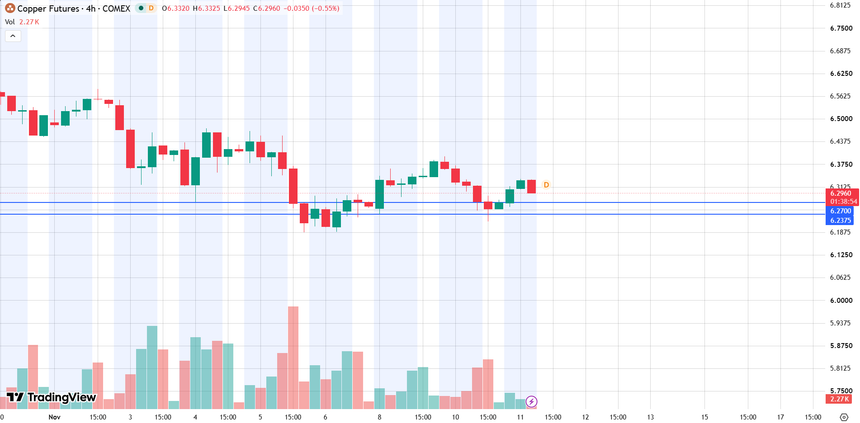
The reversal also left a fresh price gap, formed on Monday between about $6.2375 and $6.25, exposed to pressure. That zone is now the first line of defense for anyone hoping that the rebound can survive.
A Map Of The Key Levels
Three areas are important. The first is the lower line of the channel, which has framed the fall since the end of October and acts as the border between a bearish and a recovering market. The second is the gap near $6.2375 to $6.25. The third is the 38.2% Fibonacci retracement on the weekly chart, at $6.2289, which sits just beneath the gap.
The 38.2% level was also tested on the daily chart, where the market met resistance after climbing from the lows of the drop that ended on November 5. Fibonacci levels are not magic, but many traders watch them, and this makes them more likely to cause reactions.
What Monday’s Candle Already Hinted
Looking back, the signal was present on Monday. The candle closed with a long wick above its body, a sign that buyers pushed higher during the day but could not keep the gains. Such a shape often suggests that sellers are waiting at the top, and the next session proved that this was the case.
Traders who study candles often say that the close tells more than the high. Here the close showed hesitation, and the follow-through on Tuesday was negative.
Bearish Scenario
If the price finishes a day beneath the channel line, the break of Monday will be cancelled on a daily basis. A further close under $6.2375 would fill the gap, and the market would quickly meet the weekly Fibonacci floor at $6.2289.
That floor held at the close of last week, even while the larger picture was getting worse. A new drop toward it would bring back concerns about the long-term structure of copper. The main worry is that an earlier move above the top of a large rising channel could be cancelled, which would be a serious warning for the whole trend.
Bullish Scenario
Buyers still have a path. A finish above the channel line on the daily chart would keep the rebound alive, and holding the new gap would protect the nearest support. If both conditions are met, sellers would lose the initiative, and a new try at the recent high of $6.396 would be possible.
Because copper is used in construction, electronics and power grids, its price also follows the mood of the global economy. Signs of steady demand may help buyers, while a firm dollar or fears about slower growth can add pressure and favor the bearish case.
Support And Resistance Levels
On the upside, the first resistance is the lower line of the channel, near the current price. Above it, the $6.396 high from Tuesday is the main barrier, and a close over it would be a strong signal for buyers.
On the downside, the gap between $6.2375 and $6.25 is the first support. Below it, $6.2289 is the key floor, and the lower edge of Friday’s gap, near $6.22, sits just under it. A break beneath that area would strengthen the bearish scenario.
What Traders Can Do
Sellers may wait for a daily close beneath $6.2375. If it appears, a short position could aim for $6.2289, with a stop-loss above the channel line in case the market turns higher.
Buyers may prefer to stay on the sidelines until the price closes again above the channel. That move would show that the rebound has survived, and $6.396 could then become the next target. Position size should stay moderate, since copper can change direction quickly when economic data or the dollar move, and the daily candle should be allowed to finish before acting.
Conclusion
Copper has retreated from $6.396 and now trades in a sensitive area, where the channel line, the Monday gap and the weekly Fibonacci support are all packed within a narrow range. The $6.2375 to $6.25 gap and the $6.2289 level are the key supports, while $6.396 is the main upside target.
Traders following Commodities strategies should watch the daily close, the dollar and the reaction at these levels, since these factors are likely to guide the next move in copper.