
Gold returned to focus after recovering from a two-week low and moving back above the psychologically important $4,000 level. Softer US inflation data, a weaker dollar, and renewed buying around established support helped the metal regain part of the ground lost earlier in the week.
Brokers from Fondesia.com examine whether the rebound can develop into a broader recovery or whether high energy prices and uncertainty surrounding future interest-rate policy could limit the upside.
Spot gold rose more than 2% during Tuesday’s session, reaching approximately $4,100.49 per ounce at its peak before easing. US gold futures also strengthened as traders reduced expectations of an immediate rate increase.
Technical Outlook Improves Above $4,000
The recovery above $4,000 has stabilized the short-term chart. This level has become an important psychological and structural support because sellers have been unable to maintain pressure below it.
Price action now suggests that gold is trying to reclaim its short-term moving averages. A daily close above the nine-day Exponential Moving Average, followed by confirmation above the 20-day EMA, would indicate that the recent recovery is becoming more established.
However, the move does not yet confirm a complete trend reversal. Gold remains below several earlier July levels, and buyers still need to prove they can hold the market above resistance rather than produce only a brief rebound.
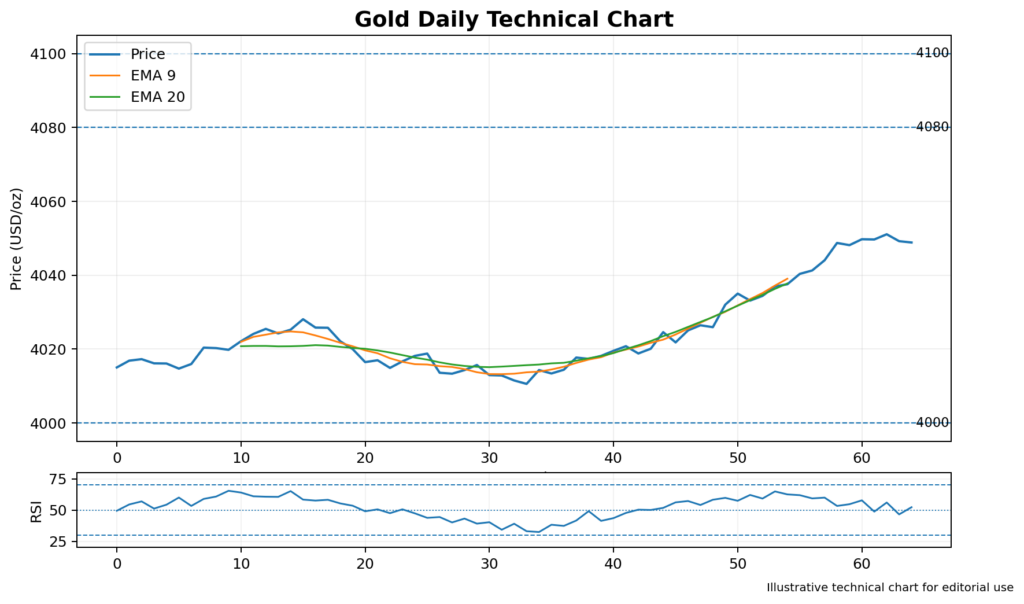
Image 1: Gold Daily Chart With the 9-Day EMA, 20-Day EMA, $4,000 Support and Resistance Near $4,100
RSI Signals Improving Momentum
The 14-day Relative Strength Index weakened during the recent selloff but did not remain deeply oversold. A move back above the neutral 50 level would suggest that buying pressure is beginning to outweigh selling momentum.
The relationship between price and RSI will be important. If gold rises through resistance while RSI also records a higher reading, the recovery would receive stronger technical confirmation. If price climbs but RSI forms a lower high, bearish divergence could warn that momentum is fading.
An RSI reading above 70 would place the market in overbought territory. That would not automatically end the rally, but it could increase the likelihood of profit-taking or sideways consolidation.
Key Resistance Levels to Watch
Immediate resistance is positioned around $4,080 to $4,100. Gold recently reached slightly above $4,100 before pulling back, showing that sellers remain active in this region.
A confirmed daily close above $4,100 could encourage a move toward $4,145 to $4,160, an area linked to earlier July trading. If buyers can maintain control above $4,160, the technical outlook would improve further.
The main upside levels are therefore $4,100, $4,145, and $4,160. A failure to clear the first barrier could leave gold moving between support and resistance while traders wait for the next economic catalyst.
Support Levels and Downside Risk
The first support area is located around $4,030, followed by the major $4,000 level. Buyers may attempt to defend this region if another pullback develops.
A sustained break below $4,000 would weaken the recovery and expose approximately $3,950. The speed of any decline would also matter. A gradual retreat could represent normal consolidation, while a sharp, high-volume break would carry more bearish implications.
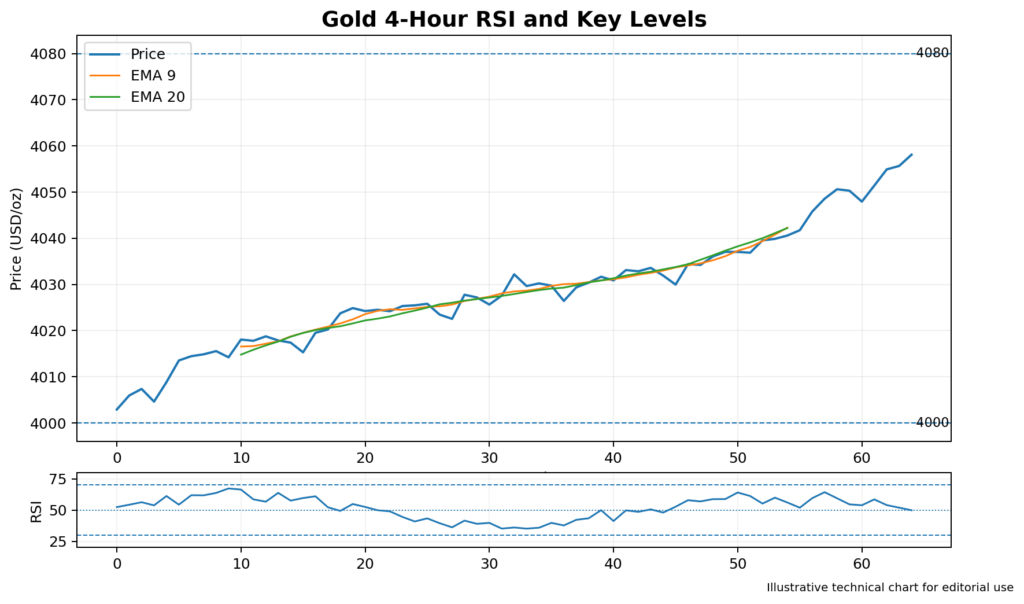
Image 2: Gold Four-Hour Chart With RSI, Support at $4,000 and Resistance at $4,080 and $4,100
Inflation Data Changes the Rate Outlook
The main catalyst behind the rebound was softer US inflation. Producer prices fell 0.3% in June, while consumer inflation also slowed more than expected. These releases reduced the perceived chance of an immediate rate increase and pushed the dollar lower.
Gold can benefit when rate expectations decline because it does not pay interest. Lower expected returns on cash and government bonds reduce the opportunity cost of holding bullion.
Nevertheless, the fundamental picture remains mixed. Oil prices have climbed sharply, renewing concern that energy costs could lift inflation again. If policymakers keep interest rates elevated for longer, gold may struggle to extend its recovery.
Market Implications
Gold retains a cautiously constructive bias while trading above $4,000. A move through $4,100, supported by an RSI reading above 50 and stronger moving-average alignment, would improve the case for further gains.
A rejection near resistance could lead to another period of consolidation around $4,030 to $4,000. A confirmed break below $4,000 would shift attention toward $3,950 and weaken the short-term bullish argument.
Conclusion
Gold has regained stability after its recent decline, helped by cooler inflation data and a softer dollar. The recovery above $4,000 provides buyers with a clearer technical foundation, but additional confirmation is still needed.
Resistance is positioned at $4,080 to $4,100, followed by $4,145 and $4,160. Support remains concentrated around $4,030, $4,000, and $3,950.
The next directional signal may depend on whether gold can remain above its short-term moving averages while RSI strengthens. Until then, the metal appears to be in a recovery phase rather than a fully confirmed bullish continuation.