
Gold moved lower on Thursday as rising oil prices renewed inflation concerns and strengthened expectations that major central banks may keep policy tight. Spot gold fell 0.9% to around $4,091 per ounce, retreating from a two-week high.
This analysis from Lucovox.com examines whether gold can hold above $4,050 or whether stronger interest-rate expectations could push the metal back toward $4,000.
Oil Prices Change the Rate Outlook
Gold had benefited from a softer dollar and geopolitical uncertainty earlier in the week. That support weakened after Brent crude surged toward $98 per barrel as renewed attacks on shipping increased concern about Middle Eastern energy supplies.
Higher oil prices can feed into transportation, manufacturing, and consumer costs.
The main risk for gold is that persistent energy inflation forces central banks to delay rate cuts or consider further tightening.
That matters because gold does not provide interest. When bond yields and cash returns rise, holding non-yielding assets becomes less attractive.
The Daily Chart Is Losing Momentum
Gold has moved away from its recent high and is testing its short-term technical structure.
The 20-day Exponential Moving Average is the first important support indicator. Remaining above it would suggest the decline is still a controlled pullback.
The 50-day EMA sits lower and provides a broader measure of direction.
A sustained break beneath both moving averages would confirm that sellers are gaining control of the medium-term trend.
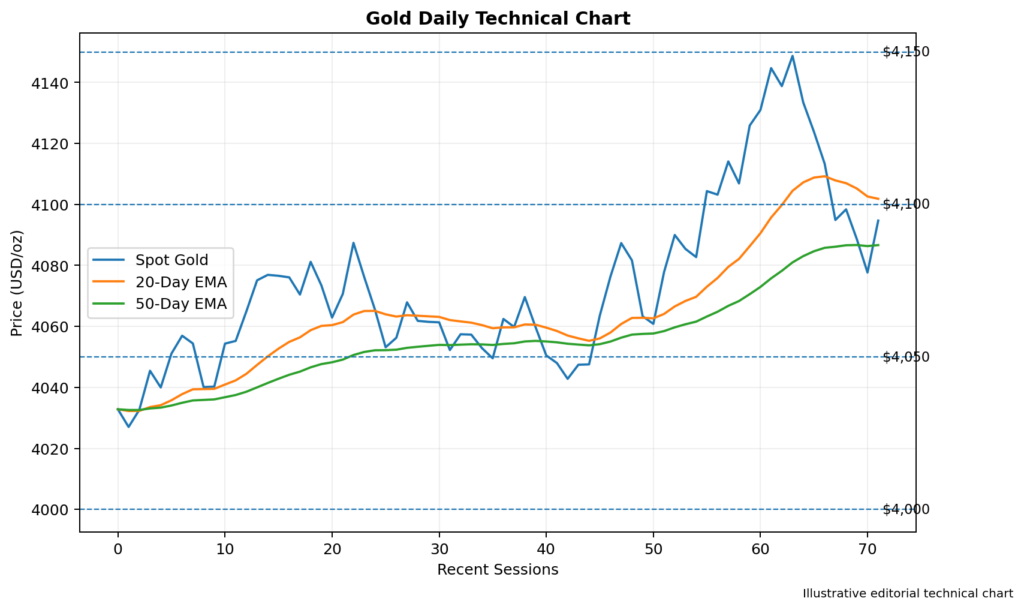
Image 1: Gold Daily Chart With the 20-Day and 50-Day EMAs, Support at $4,000 and Resistance Near $4,150
RSI Signals Weaker Buying Pressure
The 14-day Relative Strength Index has fallen as gold moved lower.
A drop below the neutral 50 level would show that short-term momentum has shifted toward sellers.
If RSI approaches 30, gold would enter oversold territory and may attract bargain buyers.
However, oversold conditions alone would not confirm a rebound. Traders would likely wait for the RSI to turn higher while the price stabilizes.
Support Begins Near $4,050
The first support zone is positioned around $4,050.
This area may determine whether buyers can defend the recent recovery.
A decisive break below $4,050 could expose the psychological $4,000 level.
Further weakness may bring $3,950 into view, followed by the recent low near $3,900.
A sustained move below $3,900 would weaken the broader structure and suggest that the correction has further to run.
Resistance Remains Near $4,100
The first barrier is located around $4,100.
Gold would need to recover above this level to reduce immediate selling pressure. The next resistance area appears near $4,150, followed by $4,200.
A daily close above $4,200 would provide stronger evidence that buyers have regained control.
Without that confirmation, recovery attempts may continue to attract selling.
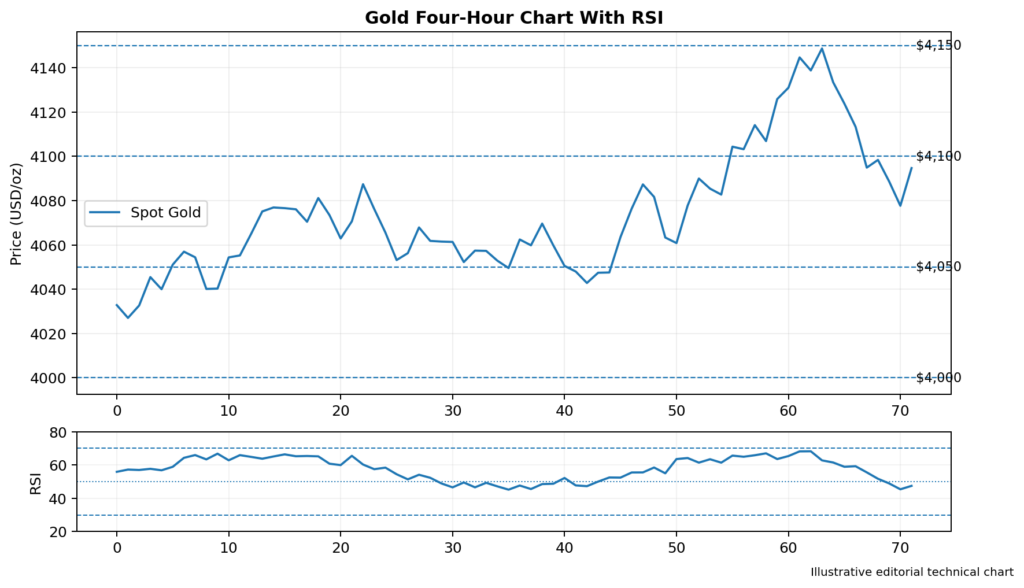
Image 2: Gold Four-Hour Chart With RSI, Support at $4,050 and $4,000, and Resistance at $4,100 and $4,150
Federal Reserve Expectations Weigh on Gold
Markets have increased expectations that the Federal Reserve could raise rates later in the year if energy costs continue to lift inflation.
The estimated chance of a September increase reportedly rose from 68% to 78% as oil prices climbed.
A higher-for-longer interest-rate environment would create a clear headwind for gold.
Rising Treasury yields may strengthen the dollar and increase the opportunity cost of holding bullion.
Softer labor-market data, weaker spending, or lower oil prices could reduce rate-hike concerns and restore support.
Geopolitical Risk Limits the Downside
Gold continues to receive support from the uncertainty surrounding the Middle East.
Investors often turn to bullion during periods of military escalation, shipping disruption, or financial-market stress.
Gold is caught between stronger inflation-driven yields and continued demand for protection against geopolitical risk.
That balance helps explain why the market has weakened without collapsing.
Longer-Term Technical Risks Remain
Gold previously dropped almost 30% from its January peak before recovering in July.
Important longer-term support has been identified around the 20-month moving average near $3,821 and the 50% Fibonacci retracement level close to $3,702.
Those levels remain some distance below the current market, but they show why holding above $4,000 is important.
A failure to defend $4,000 could reopen discussion of a wider bearish reversal.
Trading Implications
Gold keeps a neutral-to-cautious short-term outlook while trading below $4,100.
A recovery above $4,100 could expose $4,150 and $4,200. Stronger RSI readings and falling bond yields would support that scenario.
A break below $4,050 would shift attention toward $4,000 and $3,950.
Continued oil strength and rising rate expectations would increase the downside risk.
Conclusion
Gold has fallen toward $4,090 as higher oil prices revive concerns about inflation and future interest-rate increases.
Resistance is positioned near $4,100, $4,150, and $4,200. Support can be found around $4,050, $4,000, $3,950, and $3,900.
The technical outlook remains fragile below $4,100, but geopolitical risk may continue to limit the decline.