
The FTSE 100 moved sharply higher on Wednesday as rising oil and metal prices lifted some of the largest companies in the index. London’s blue-chip benchmark closed 1.2% higher at 10,717, its strongest level in more than four months.
This analysis from Lucovox.com examines whether the FTSE 100 can stay above 10,700 or whether changing interest-rate expectations and continued uncertainty in the Middle East could interrupt the rally.
Commodity Shares Set the Pace
Oil producers and mining companies provided much of the momentum.
These businesses carry a large weighting in the FTSE 100, so even moderate gains can move the wider index. The advance also followed a positive Tuesday session, when banking and energy shares helped the market recover from a weaker start to the week.
Commodity strength remains the main reason the FTSE 100 is outperforming more domestically focused UK stocks.
The Daily Chart Looks More Constructive
The index has moved above several recent resistance areas and is trading above its short-term moving averages.
The 20-day Exponential Moving Average is the first technical level to watch. Remaining above it would suggest the latest rise has enough support to continue.
The 50-day EMA provides a broader view of the trend. With the index above both averages, the medium-term structure remains positive.
The main question is whether the FTSE can hold above 10,700. A quick return below this level would show that buyers struggled to maintain the breakout.
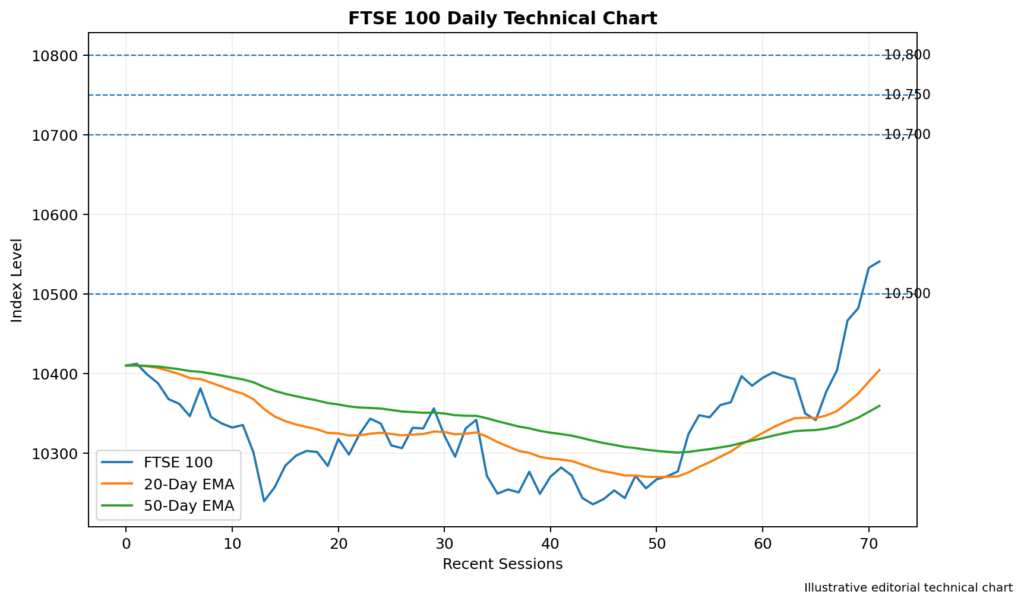
Image 1: FTSE 100 Daily Chart With the 20-Day and 50-Day EMAs, Support at 10,500 and Resistance Near 10,750
RSI Shows Stronger Momentum
The 14-day Relative Strength Index has risen with the index.
A reading above 50 would confirm that buying momentum remains stronger than selling pressure. A move toward 60 or 65 could support another test of the recent high without showing that the market is excessively stretched.
If RSI moves through 70, the index would enter overbought territory and consolidation could become more likely.
Resistance Appears Near 10,750
The first barrier sits around 10,750, just above Wednesday’s closing level.
A firm move through this area could bring the psychological 10,800 level into focus.
If the FTSE clears 10,800, the next targets may appear around 10,900 and 11,000.
A sustained breakout would likely require firm commodity prices, stable earnings, and steady global risk appetite.
Support Remains Near 10,700
The first support area is around 10,700. Holding above it would strengthen the case that the breakout is genuine.
A pullback below 10,700 could expose 10,600, while further weakness may bring 10,500 back into focus.
A sustained drop beneath 10,500 would weaken the short-term structure and increase the risk of a deeper correction.
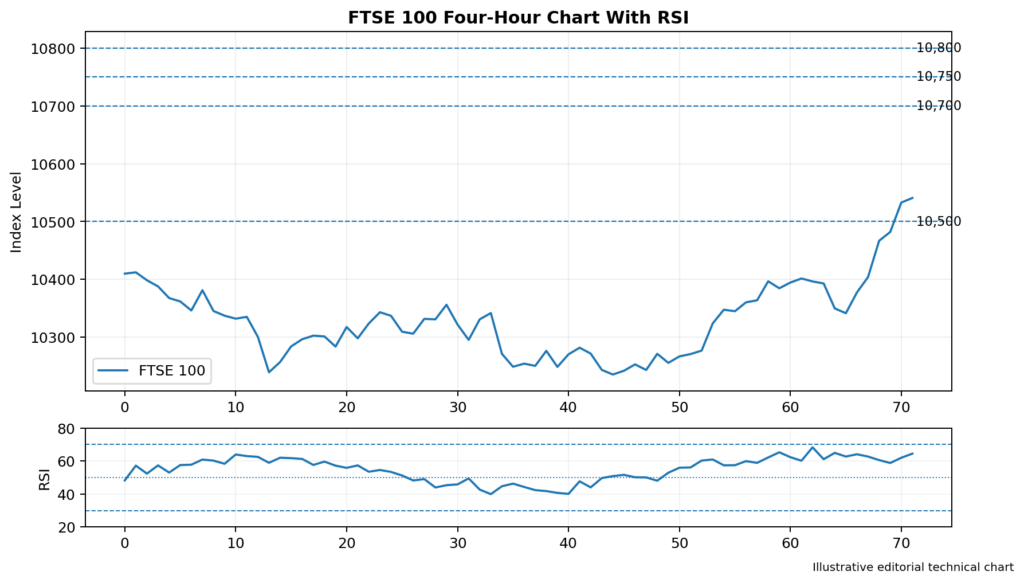
Image 2: FTSE 100 Four-Hour Chart With RSI, Support at 10,700 and 10,500, and Resistance at 10,750 and 10,800
Oil and Metal Prices Remain Central
The rally came as crude oil and industrial metals moved higher amid supply concerns.
Commodity-linked companies often benefit because stronger selling prices can improve expected revenue and cash flow.
However, expensive energy can raise costs for manufacturers, transportation companies, and households while adding to inflation pressure.
The same oil rally supporting the FTSE could make the Bank of England more cautious about cutting rates.
Bank of England Expectations Matter
Higher energy prices may make inflation more difficult to control, reducing the chance of rapid policy easing.
That could pressure homebuilders, property companies, and consumer businesses.
Banks may respond differently. Higher rates can improve lending margins, although weaker growth and softer credit demand create risks.
Interest-rate expectations could therefore create a wider gap between the strongest and weakest FTSE sectors.
Wider Market Participation Improves
The FTSE 250 also advanced and reached its highest level in more than four years.
That is encouraging because the mid-cap index has greater exposure to the domestic UK economy.
When both indexes rise together, the rally appears broader than a move driven only by energy and mining companies.
Trading Implications
The FTSE 100 keeps a bullish short-term bias while trading above 10,700 and its main moving averages.
A confirmed break above 10,750 could expose 10,800 and 10,900. Improving RSI and further commodity gains would support that scenario.
A move below 10,700 would weaken the immediate picture, while a sustained break beneath 10,500 could signal that momentum is fading.
Conclusion
The FTSE 100 has climbed above 10,700 as energy and mining shares lead a broader UK market advance.
Resistance is positioned near 10,750, 10,800, 10,900, and 11,000. Support can be found around 10,700, 10,600, and 10,500.
The technical picture favors buyers, but the reaction around 10,750 should show whether the rally can continue or needs time to consolidate.