
Gold (XAU/USD) extended its decline for a third consecutive session, slipping to a fresh one-week low in the $4,122–$4,121 range during Friday’s Asian session. The metal continues to trade under a clearly defined short-term bearish structure, with price action failing to stabilize above key dynamic resistance levels and instead accelerating lower in response to macro-driven USD strength.
The broader trend remains anchored by a combination of rising US yields, a persistently firm US Dollar Index (DXY) near 2025 highs, and weakening demand for non-yielding assets.
Spot gold is now trading roughly 2.3%–2.8% lower week-to-date, reinforcing the probability of a third consecutive weekly decline. The article provides a comprehensive analysis of this subject from Rubinax’s brokerage team.
Dollar Strength and Rate Expectations Drive Macro Pressure
The dominant macro driver continues to be the US Dollar’s yield advantage, supported by a structurally hawkish Federal Reserve stance. The policy rate remains unchanged in the 3.50%–3.75% corridor, yet forward guidance signals a clear tightening bias.
The latest dot plot distribution shows approximately 47% of policymakers projecting at least one additional rate hike in 2026, conditional on sticky inflation dynamics above the 2% target band. This has shifted the policy narrative from a pause cycle toward a prolonged restrictive regime.
Market pricing reflects this repricing with the CME FedWatch Tool assigning ~70% probability to a 25 bp hike in September, up from sub-50% levels earlier in the month. This has driven 2-year Treasury yields toward the 4.9%–5.1% zone, reinforcing capital inflows into USD-denominated assets.
The result is a persistent expansion in real yields, which historically correlates negatively with gold. The inverse correlation coefficient between DXY and XAU/USD remains strongly negative near -0.80, highlighting tight macro coupling.
Liquidity Conditions and Short-Term Flow Sensitivity
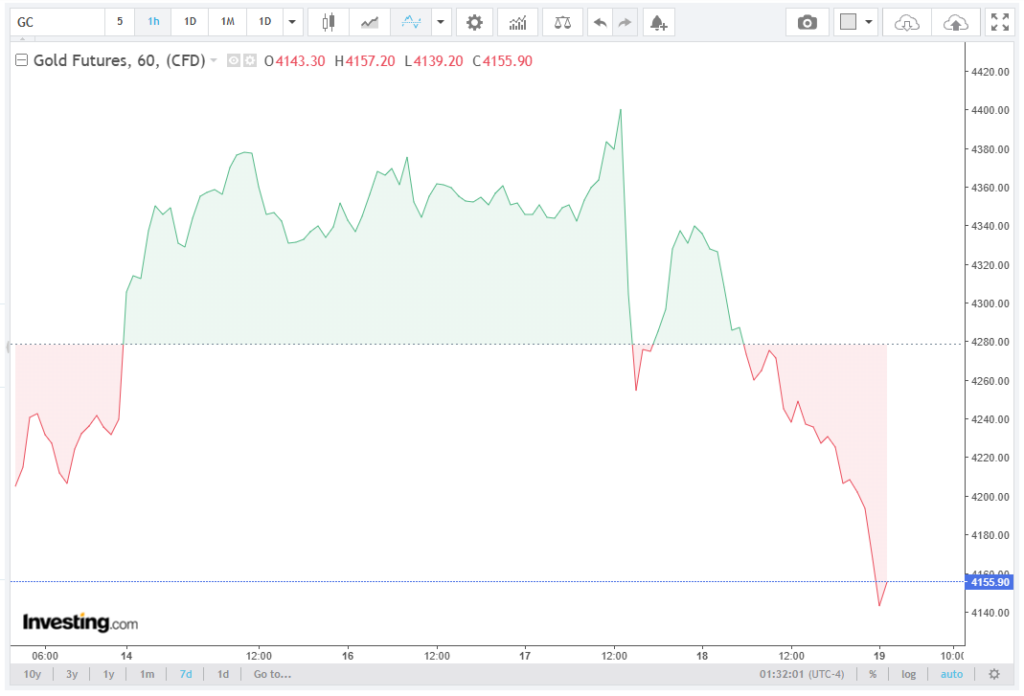
Trading conditions remain thinned due to the US holiday calendar, reducing depth in spot markets and amplifying intraday volatility bands. Average daily volume in gold futures has declined by an estimated 18%–22% versus the 20-day mean, increasing sensitivity to macro headlines and algorithmic flows.
Despite reduced liquidity, the directional bias remains firmly negative, with price structure continuing to respect lower highs and lower lows on the 4-hour and daily timeframes.
Technical Breakdown: EMA Compression and Momentum Weakening
From a technical standpoint, gold continues to exhibit a bearish EMA alignment regime. The failure to reclaim the 100-day Exponential Moving Average (EMA) has reinforced downside continuation, with price rejection occurring multiple times between $4,180 and $4,220.
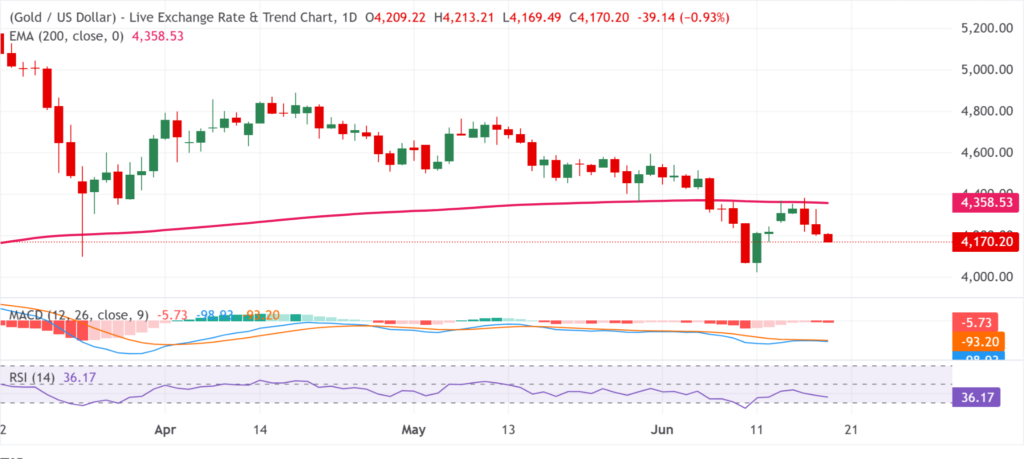
The current price trajectory sits below the 20-day, 50-day, and 100-day EMAs, confirming a multi-layered bearish configuration. The next structural reference remains the 200-day EMA at $4,358.53, which now acts as a medium-term resistance ceiling.
Momentum indicators continue to validate downside pressure. The Relative Strength Index (RSI) is positioned near 36.2, reflecting weak demand conditions but not yet reaching deeply oversold territory below 30. This suggests further downside capacity remains before exhaustion signals emerge.
The MACD remains firmly negative, with the signal line divergence widening and histogram bars flattening in negative territory. This indicates that downside momentum is stabilizing rather than reversing, consistent with a trend continuation phase rather than capitulation.
Volatility-adjusted momentum metrics also show compression, with the 14-day ATR stabilizing near 38–42 points, implying controlled but persistent directional drift rather than spike-driven liquidation.
Key Price Zones and Structural Thresholds
Immediate downside focus is shifting toward the psychological $4,100 level, which now represents the next liquidity pocket and potential short-term magnet for price discovery. A decisive break below this level would expose lower support zones near $4,060 and $4,020, where prior consolidation structures were observed.
On the upside, recovery attempts remain capped unless price reclaims the $4,250–$4,270 resistance band, followed by a sustained move above the 200-day EMA at $4,358.53. Such a breakout would be required to neutralize the current bearish regime and reintroduce medium-term bullish positioning.
Until that threshold is reclaimed, rallies are likely to be sold into EMA resistance clusters, with momentum flows favoring continuation rather than reversal.
Outlook: Macro Dominance Keeps Gold Biased Lower
The near-term outlook for gold remains driven by interest rate expectations, USD yield differentials, and real yield expansion. With markets pricing further tightening and Treasury yields elevated, the opportunity cost of holding gold stays structurally high.
At the same time, geopolitical risk is not producing a sustained safe-haven flow into bullion, instead reinforcing USD liquidity preference. This creates a feedback loop where tight macro conditions suppress gold even during global uncertainty.
Overall, a bearish technical structure, high real yields, and USD strength continue to favor downside pressure. With price nearing the $4,100 inflection zone, gold remains in a technically vulnerable regime, with momentum biased toward further downside unless macro conditions shift materially.