
The GBP/USD pair is trading weaker for the fourth consecutive session, hovering around 1.3430 during the European trading hours on Tuesday. Despite the recent decline, the daily chart structure continues to reflect a bullish technical bias, with the pair holding inside an established ascending channel.
The brokers at BCR Limited take an in-depth look at this topic throughout the article.
The current price action is focused on the immediate support zone near 1.3426, represented by the nine-day Exponential Moving Average (EMA). This level is technically important as it also aligns with the lower boundary of the ascending channel, creating a strong area where buyers may attempt to stabilize the pair.
GBP/USD remains positioned above both the 9-day EMA and the 50-day EMA, which are currently located near 1.3426 and 1.3386, respectively. The price relationship with these moving averages indicates that the short-term trend and medium-term trend remain supportive of further upside potential.
As long as the pair trades above these dynamic support levels, the broader bullish trend structure remains valid.
Momentum Indicators Confirm Moderate Buying Pressure
The 14-day Relative Strength Index (RSI) is currently positioned around 55, indicating that momentum remains positive but not overextended. A reading above the neutral 50 level suggests that buyers maintain a slight advantage, while the absence of an overbought reading above 70 indicates that GBP/USD still has room for additional upward movement.
The RSI structure supports the view that the recent decline may represent a technical correction rather than a full trend reversal. Momentum remains balanced, allowing the pair to potentially resume its advance if support levels continue to hold.
The alignment of the 9-day EMA above the 50-day EMA also reinforces the current upward market structure. This type of moving average configuration typically reflects sustained buying interest and a gradual improvement in market sentiment.
GBP/USD Upside Targets: 1.3630 Channel Resistance and 1.3658 High
A successful defense of the 1.3426 EMA support level could encourage renewed buying pressure toward the upper boundary of the ascending channel near 1.3630. This area represents the next major technical resistance level on the daily chart.
A decisive break above 1.3630 would strengthen the bullish outlook and expose the previous five-month high at 1.3658, reached on May 1. The ability to clear this resistance zone would signal increasing demand and could accelerate the next bullish phase.
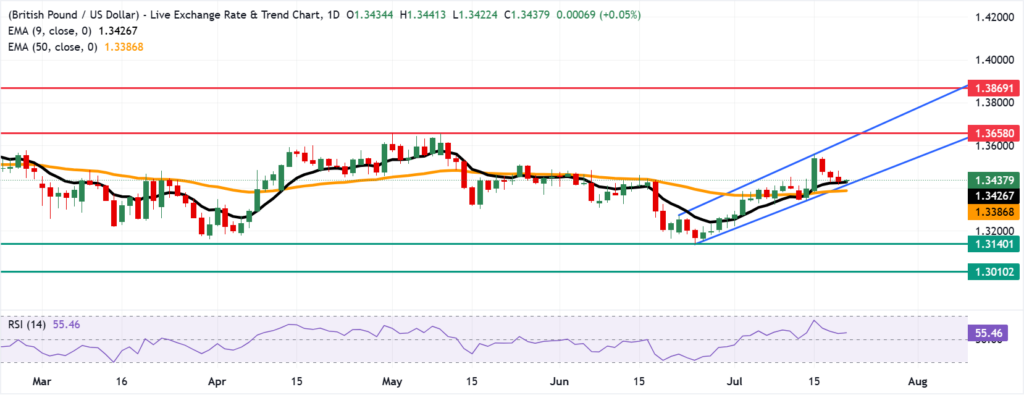
Above 1.3658, the next significant resistance target is located at 1.3869, which marks the highest level since September 2021 and was reached on January 27. A move toward this level would indicate a broader continuation of the recovery trend and confirm stronger bullish momentum.
However, traders are likely to monitor the 1.3630–1.3658 resistance region closely, as this area may attract selling pressure from market participants looking to secure profits after previous gains.
Downside Risks: 1.3386 EMA and 1.3140 Support Levels
Although the technical outlook remains positive, GBP/USD faces increasing downside risks if it loses its key moving average support. The first critical level remains the nine-day EMA at 1.3426. A daily close below this level would weaken the short-term bullish structure and increase the possibility of further declines.
The next support zone is located at the 50-day EMA near 1.3386. This medium-term indicator represents a major technical barrier because a sustained move below it would suggest that buyers are losing control of the trend.
A confirmed break beneath the 50-day EMA could shift attention toward the 1.3140 region, which represents the eight-month low recorded on June 24. A decline toward this level would indicate a deeper correction and a potential change in the broader market structure.
GBP/USD Forecast: Buyers Need to Defend 1.3426 to Maintain Bullish Bias
The GBP/USD technical forecast remains moderately bullish as long as the pair continues trading above the 9-day EMA at 1.3426 and the 50-day EMA at 1.3386. The combination of a positive RSI reading near 55, a stable ascending channel, and supportive EMA alignment suggests that the broader upward trend remains active.
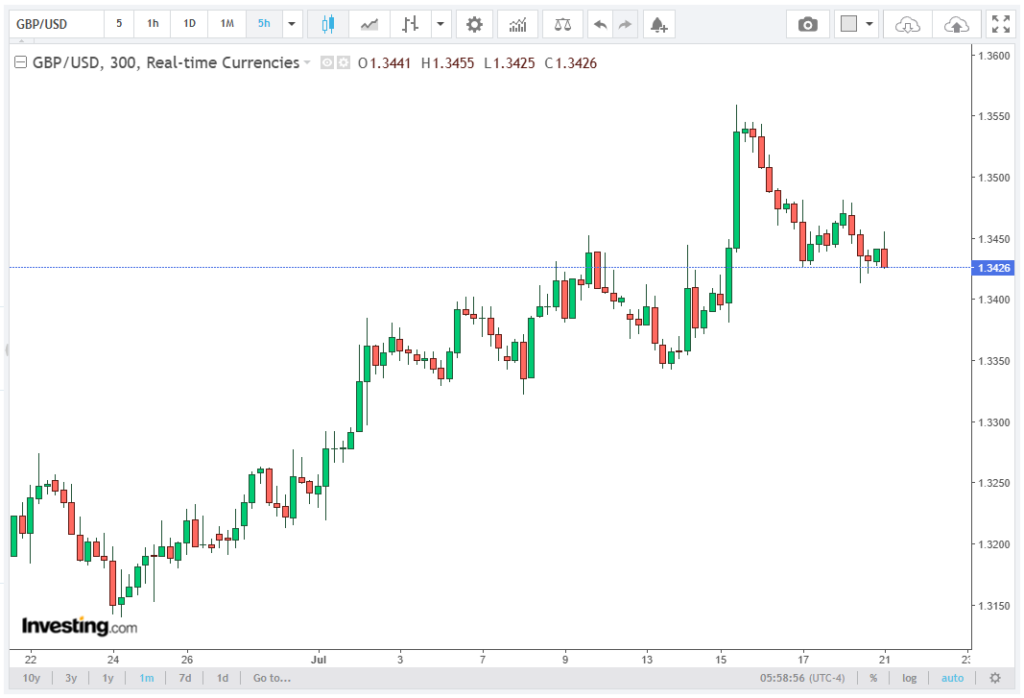
The immediate market focus is on whether buyers can defend the 1.3400–1.3426 support zone. Holding this region could provide the foundation for a move toward 1.3630, followed by 1.3658 and potentially 1.3869.
Conversely, a break below 1.3386 would weaken the bullish setup and increase the probability of a decline toward 1.3140. Until that breakdown occurs, GBP/USD continues to maintain a constructive technical outlook, with the current pullback viewed as a test of key support rather than a confirmed trend reversal.