
West Texas Intermediate (WTI) crude oil remains under mild selling pressure after failing to extend the previous session’s recovery from the $79.50-$79.45 demand zone.
The US crude benchmark is trading around the $81.80 area, slightly below the recent one-month high reached near June 12 levels, as bullish traders pause while awaiting further developments surrounding the Middle East geopolitical crisis.
In this article, the brokers at BCR Limited provide a detailed exploration of this topic.
Despite the intraday weakness, the broader technical structure remains supportive for buyers. WTI continues to trade above key recovery levels after a strong advance from the recent cycle low, indicating that the market has shifted from a bearish correction phase toward a potential medium-term recovery trend.
The current price action reflects a balance between geopolitical risk premium, concerns over global oil supply disruptions, and uncertainty surrounding potential diplomatic developments. While expectations of easing tensions have limited aggressive buying, supply-side risks continue to provide a foundation for crude oil prices.
Geopolitical Risks Limit Downside Pressure on Crude Oil
The recent weakness in WTI prices has been influenced by expectations that diplomatic developments could ease energy supply disruption concerns. A potential improvement in regional stability may reduce the crude oil risk premium, limiting upside momentum.
However, downside risks remain contained due to ongoing threats affecting major energy routes. Reduced traffic through the Strait of Hormuz and rising Red Sea security risks continue to support oil prices by sustaining global supply concerns.
Technical Analysis: 200-SMA Breakout Keeps Bulls in Control
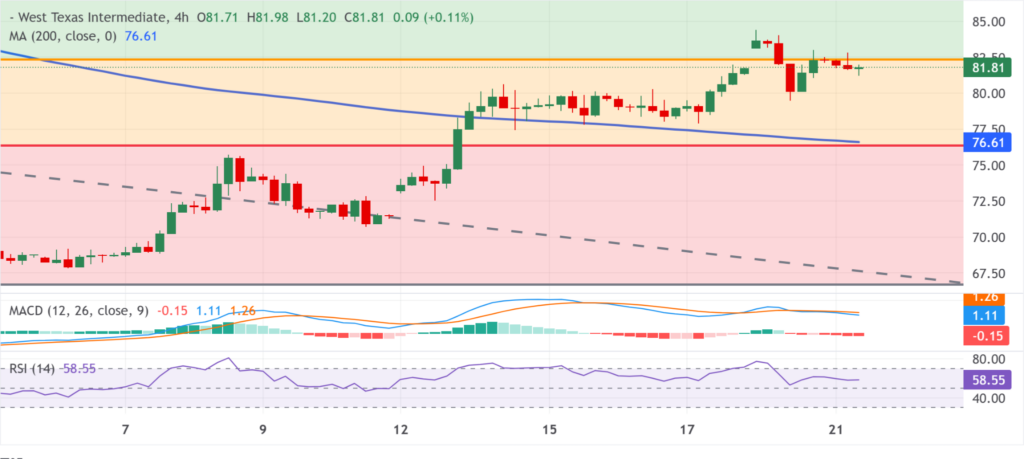
From a technical perspective, the recent breakout above the 200-period Simple Moving Average (SMA) on the 4-hour chart remains a significant bullish signal. WTI’s move above this long-term trend indicator suggests that buyers have regained control after the previous decline.
The breakout was further supported by a move above the 38.2% Fibonacci retracement level of the May-July decline, confirming stronger recovery momentum. However, the inability to sustain a move beyond the 50.0% Fibonacci retracement level indicates that bullish momentum has started to weaken.
The immediate technical resistance remains located at the 38.2% Fibonacci level near $82.34. A decisive daily close above this region would strengthen the bullish outlook and expose higher targets.
The next major resistance zone is positioned around the 50.0% Fibonacci retracement level at $87.17, followed by the 61.8% Fibonacci retracement level near $92.00. A move toward these levels would indicate a broader continuation of the recovery phase.
Momentum Indicators Show Mixed Signals Before the Next Move
Although the overall trend remains constructive, momentum indicators are signaling caution. The Relative Strength Index (RSI 14) on the 4-hour timeframe has declined toward 58.55, moving away from stronger bullish territory and suggesting that buying pressure has moderated.
The Moving Average Convergence Divergence (MACD) indicator has also weakened, moving below the zero line, which indicates that short-term momentum is losing strength.
These signals do not necessarily confirm a bearish reversal, but they suggest that WTI may require additional consolidation before attempting another leg higher. Traders are likely to monitor whether momentum indicators stabilize while price remains above key technical support areas.
A recovery in RSI back above the 60.00–65.00 zone, combined with a bullish MACD crossover, would provide stronger confirmation of renewed upside momentum.
Key Support Levels Define the Bullish Scenario
On the downside, the first important support zone is located near the 200-period SMA at $76.61, closely aligned with the 23.6% Fibonacci retracement level at $76.37. This area represents a critical technical defense for buyers.
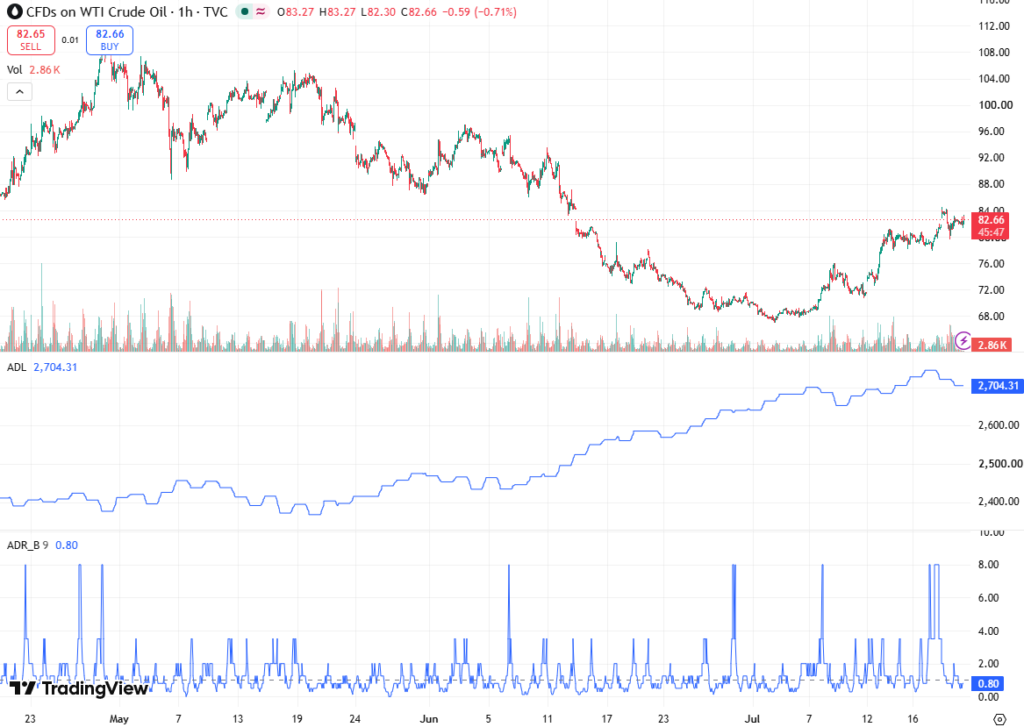
Holding above the $76.37–$76.61 support region would preserve the current bullish recovery structure and maintain the possibility of another move toward higher resistance levels.
However, a sustained breakdown below this zone would weaken the bullish outlook and expose WTI to deeper losses. The next significant structural support is located near the Fibonacci cycle low at $66.72, which would represent a major technical reversal point.
WTI Forecast: Recovery Trend Holds Above Key Technical Supports
The WTI price forecast remains cautiously bullish as crude oil continues to trade above major technical support levels following the breakout above the 200-SMA and the 38.2% Fibonacci retracement zone.
The immediate challenge for buyers is the $82.34 resistance level, where stronger momentum is required to confirm further upside. A successful breakout could open the path toward $87.17 and eventually $92.00.
However, the combination of a weakening RSI, a softer MACD profile, and uncertainty surrounding geopolitical developments suggests that additional gains may require confirmation.
As long as WTI remains above the $76.37–$76.61 support area, the broader bullish structure remains valid, with traders focused on whether the market can overcome the $82.00–$82.34 resistance barrier and continue its recovery toward higher Fibonacci targets.