
European natural gas prices climbed to a four-month high on Monday as disruption fears returned to the energy market. The benchmark contract moved toward €60 per megawatt-hour, with traders watching shipping conditions and the risk of tighter fuel supplies.
Brokers from AchievementsAI.com examine whether prices can push through €60 and continue toward higher resistance, or whether the latest rise has moved too far too quickly.
The Recent Rise Has Changed the Chart
European gas had spent several weeks trading in a quieter range before the latest jump. The move toward €60 has lifted the price above its short-term averages and restored a more positive technical structure.
The 20-day Exponential Moving Average is the first support area to watch. Holding above it would suggest buyers still have control of the immediate trend.
The 50-day EMA provides a wider reference point. With price trading above both averages, the recent advance looks stronger than a brief intraday spike.
The difficulty is that energy markets can reverse sharply when supply concerns ease. A headline-driven rise may lose momentum quickly if shipping conditions improve.
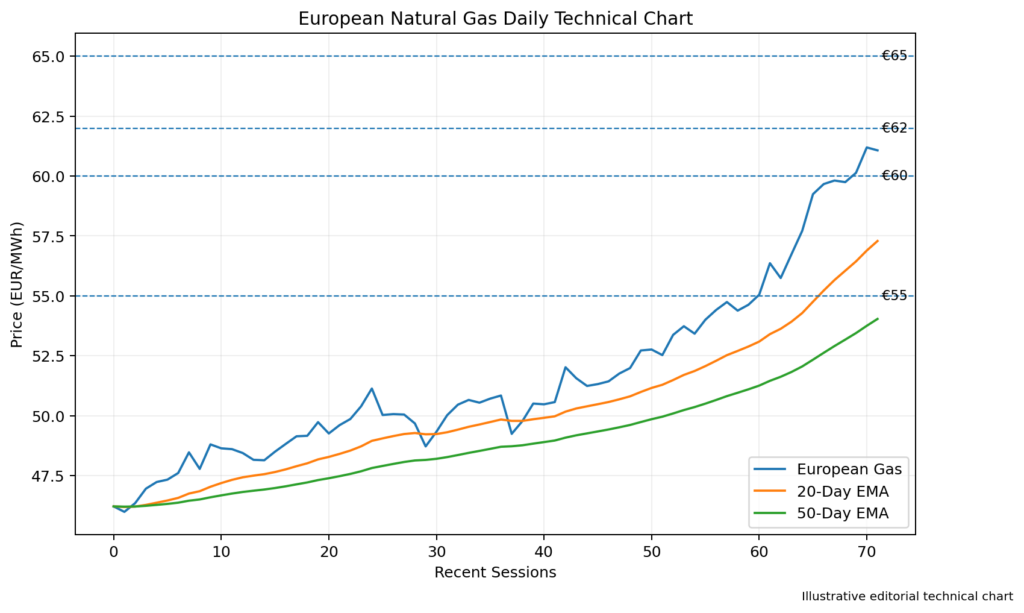
Image 1: European Natural Gas Daily Chart With the 20-Day and 50-Day EMAs, Support at €55 and Resistance Near €60
RSI May Be Starting to Look Overheated
The 14-day Relative Strength Index has risen with the price.
A reading above 50 confirms that buying momentum remains stronger than selling pressure. If RSI moves through 70, the market would enter overbought territory.
That would not necessarily trigger an immediate decline. Gas prices can stay overbought when supply fears remain intense.
The more useful warning would be divergence. If the contract records a higher high while RSI forms a lower peak, buyers may be losing some of their strength.
Resistance Begins at €60
The first barrier is the psychological €60 level. A sustained close above it would suggest that the latest move still has room to develop.
The next resistance area may appear near €62. Beyond that, traders could begin looking toward €65.
A stronger supply shock could place €70 in view, although reaching that level would probably require a significant deterioration in energy flows.
The main resistance levels are €60, €62, €65, and €70.
Support Could Appear Near €55
The first useful support zone sits around €55. A pullback toward this level would still fit with the wider upward structure.
Below €55, attention may shift to €52 and then €50.
A sustained move beneath €50 would weaken the recent breakout and suggest that the market is returning to its earlier range.
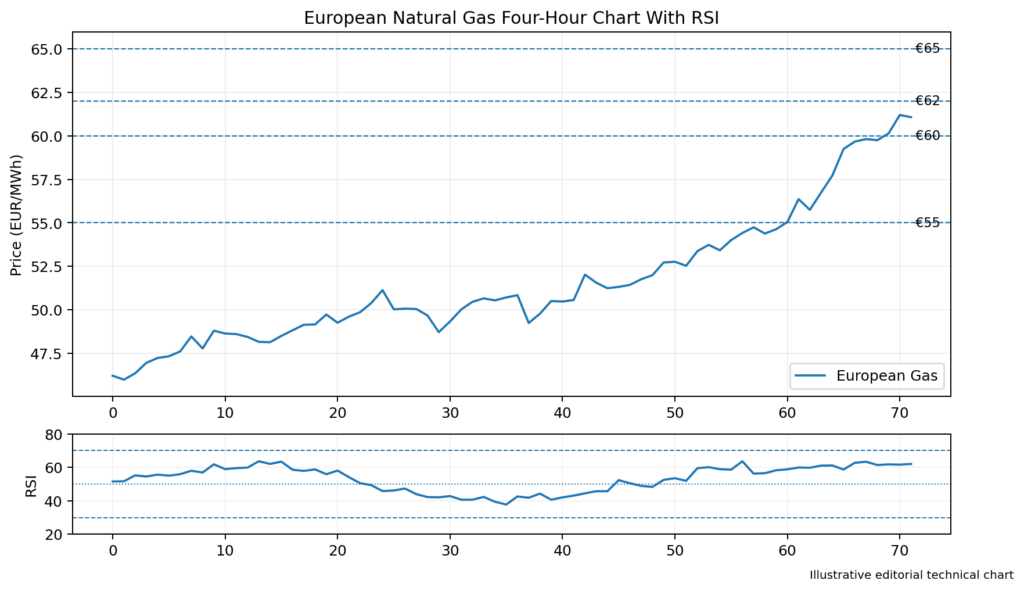
Image 2: European Natural Gas Four-Hour Chart With RSI, Support at €55 and €52, and Resistance at €60 and €62
Shipping Disruption Is Driving the Move
The latest increase is closely linked to concern about energy shipments through the Strait of Hormuz.
Reduced traffic through the region has affected expectations for oil and liquefied natural gas supplies. European gas prices reached roughly €60 per megawatt-hour, their highest level in four months, as traders assessed the risk of further disruption.
Europe relies heavily on imported LNG, so any threat to global shipping can quickly influence local prices. Buyers may compete more aggressively for available cargoes when supply routes become less reliable.
Inflation Fears Are Returning
Higher gas prices matter beyond the energy market.
Businesses that depend heavily on power and fuel may face rising costs. Some of those costs could eventually reach consumers through higher prices for transport, food, manufacturing, and household energy.
Eurozone inflation is already close to 3%, partly because of energy costs. An ECB survey showed that companies still expect wage growth and selling-price increases to moderate, suggesting that broader inflation pressure has not yet accelerated sharply.
That leaves policymakers facing an awkward balance. They may be reluctant to react to a temporary energy shock, but a longer-lasting rise could change the outlook.
Bond Markets Are Paying Attention
The increase in gas and oil prices has already affected European rate expectations.
Germany’s two-year bond yield recently moved to a two-year high as markets began pricing a greater chance of further ECB tightening. Higher energy costs can make investors less confident that inflation will return smoothly to target.
This creates an important link between gas prices, bond yields, and the wider equity market.
If energy continues rising, rate-sensitive shares and energy-intensive industries may face additional pressure.
Trading Implications
European gas keeps a bullish short-term bias while trading above €55 and its main moving averages.
A confirmed break above €60 could expose €62 and €65. Stronger RSI readings would support that move, although overbought conditions may increase volatility.
A fall below €55 would weaken the immediate picture and bring €52 and €50 back into focus.
Conclusion
European natural gas is testing €60 per megawatt-hour as supply concerns return to the market.
Resistance is positioned at €60, €62, €65, and €70. Support can be found near €55, €52, and €50.
The chart currently favors buyers, but the move remains highly sensitive to shipping news. The reaction around €60 should show whether the rally has further to run or needs a period of consolidation first.