
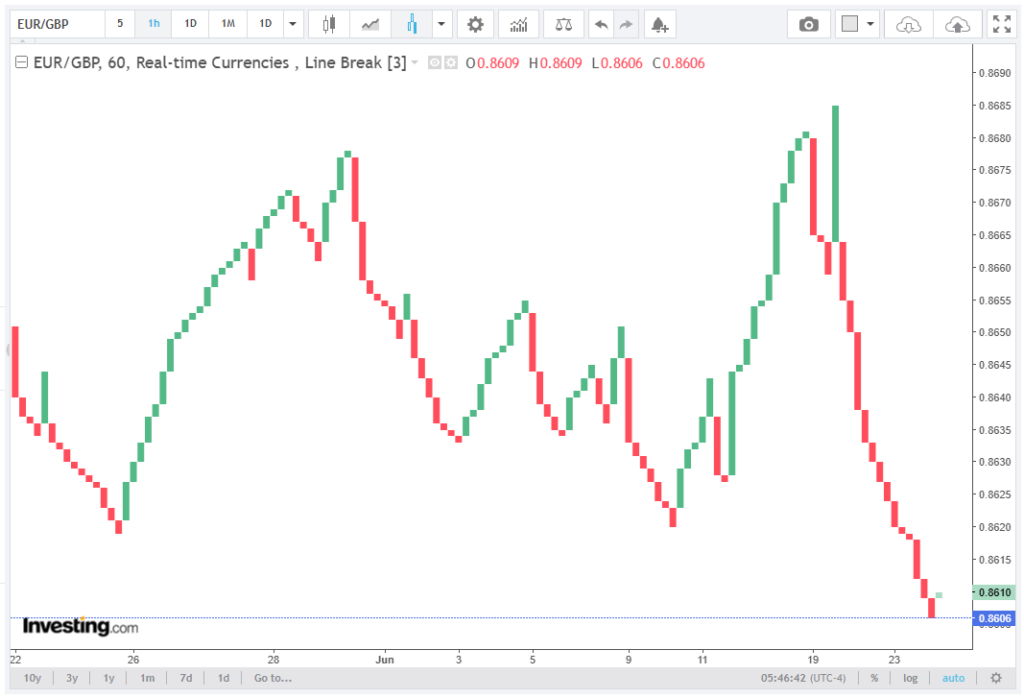
The EUR/GBP pair continues to extend its downside trajectory, trading near 0.8611, a level that marks a 10-month low and a critical structural support zone. The pair is down approximately 0.6% week-to-date, reflecting a clear dominance of GBP relative strength over the EUR in a market environment characterized by deteriorating risk appetite and persistent macro divergence.
Vaulltier’s brokers provide an in-depth exploration of this topic in the accompanying article below.
Price action remains compressed near the lower boundary of a multi-month range, with intraday flows repeatedly failing to generate sustained recoveries above the 0.8650–0.8660 supply region, reinforcing a strong bearish market structure.
Macro Backdrop: Risk-Off Conditions Strengthen GBP Relative Outperformance
The broader financial environment is firmly tilted toward risk-off positioning, with global equity markets experiencing a notable technology sector correction following an extended period of upside momentum. The unwind of concentrated positioning in high-growth assets has increased demand for defensive currency exposure, indirectly benefiting the British Pound (GBP) relative to the Euro (EUR).
At the same time, elevated geopolitical uncertainty surrounding ongoing international tensions linked to energy and security conditions has reinforced volatility across asset classes. This has resulted in higher cross-asset correlation, where equities’ weakness translates into FX positioning adjustments, favoring currencies with comparatively stable yield expectations.
In this context, GBP continues to benefit from relatively anchored rate expectations, while EUR sensitivity to Eurozone growth differentials remains a key drag. The divergence in real yield expectations between the UK and the Euro area continues to support EUR/GBP downside pressure.
Technical Structure: Breakdown Pressure Intensifies at 0.8611
From a technical standpoint, EUR/GBP remains locked in a well-defined bearish channel, with price action consistently printing lower highs since the rejection from the 0.8700 region earlier in the cycle.
The pair is now consolidating directly above the key structural level at 0.8611, which represents both a multi-month horizontal support and a liquidity zone where prior demand has previously emerged. However, repeated tests of this level increase the probability of a liquidity sweep event, particularly if momentum accelerates lower.
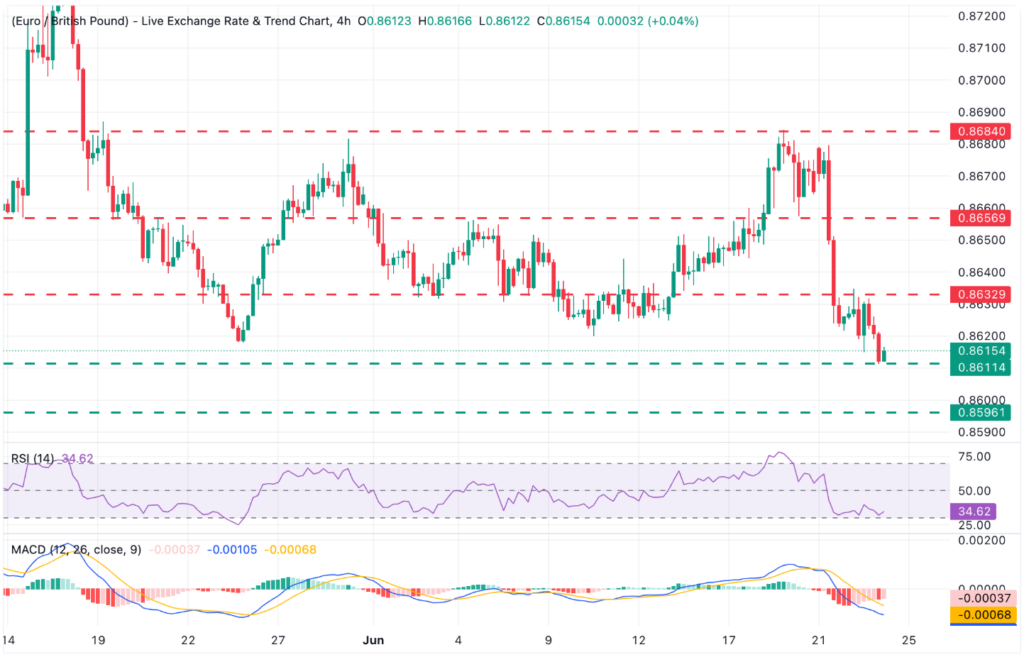
The Relative Strength Index (RSI 14, 4H) is currently positioned around the 32–38 range, hovering just above the oversold threshold of 30. This indicates persistent bearish momentum, but also suggests that downside extensions may begin to encounter short-term exhaustion only below current levels.
The MACD histogram remains negative across short-term timeframes, with signal lines below zero, confirming that trend momentum remains decisively bearish. No bullish divergence has yet formed on higher timeframes, reinforcing the absence of reversal signals.
Volatility metrics, including short-term ATR expansion near 0.0032–0.0038, suggest that breakout probability is increasing rather than stabilizing, with directional bias skewed toward continuation.
Key Support Cluster: 0.8611 Breakdown Risk
A confirmed daily close below 0.8611 would represent a structural breakdown from a 10-month base, triggering an extension of the current bearish wave.
Below this threshold, the next liquidity pocket is located at 0.8595, corresponding to the August 2025 swing low, which acts as a secondary structural floor. A breach of this level would expose the 0.8585 region, aligned with the 161.8% Fibonacci extension of the most recent corrective impulse, a classical projection zone often associated with trend acceleration phases.
The confluence of these levels suggests that a breakdown would not be isolated, but instead could trigger a multi-leg extension lower, particularly if macro sentiment remains risk-off.
Resistance Framework: Limited Recovery Potential
On the upside, recovery attempts remain technically capped by a layered resistance structure. Immediate rejection pressure is observed at 0.8634, representing the most recent intraday high and a short-term liquidity ceiling.
Beyond this, the next structural resistance sits at 0.8657, a previously broken support level now acting as supply-zone resistance. Price behavior around this region remains critical, as failed retests historically reinforce continuation of the dominant trend.
A stronger reversal signal would only emerge above 0.8680, which aligns with prior swing highs from mid-month trading activity. A break above this region would be required to neutralize the current bearish structure and shift momentum toward a range-rebuilding phase rather than a trending decline.
Outlook: Bearish Continuation Favored Below 0.8657
The near-term outlook for EUR/GBP remains decisively skewed toward the downside as long as the price remains below 0.8657. The combination of risk-off macro conditions, negative yield differentials, and bearish technical momentum continues to support downside continuation.
A sustained break below 0.8611 would likely confirm the next phase of downside expansion, exposing 0.8595 and potentially 0.8585 as active downside targets. Conversely, only a recovery above 0.8680 would begin to challenge the prevailing bearish structure and signal a transition toward consolidation rather than continuation.