
Solana (SOL) has entered a clearly defined bearish expansion phase, declining approximately 6.5% within 24 hours, with intraday volatility expanding beyond 9% peak-to-trough.
The move follows a sharp repricing in macro interest rate expectations, which has triggered systematic risk-off flows across high-beta crypto assets. Readers can explore a detailed overview of this subject in the article prepared by Vaulltier’s brokers.
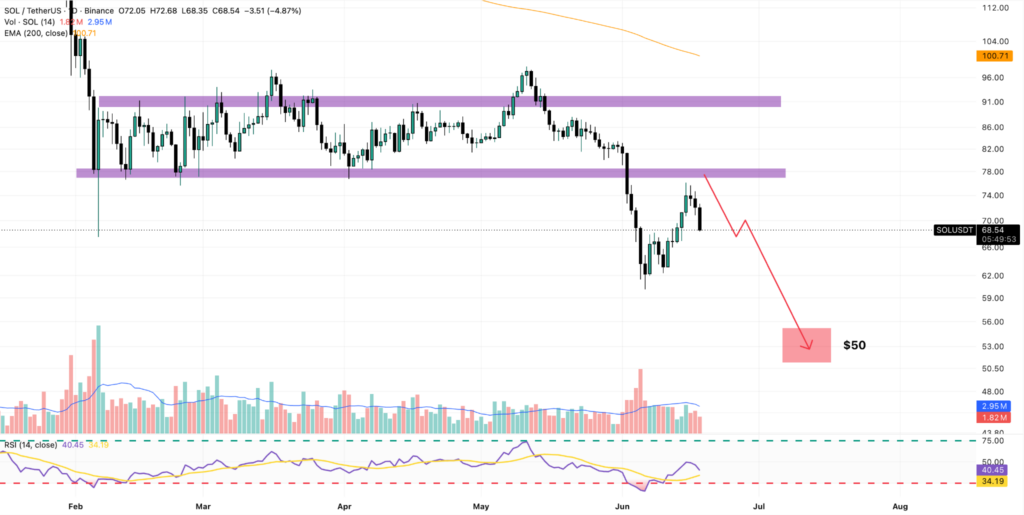
From a structural standpoint, SOL has now lost its short-term equilibrium zone between $72 and $75, which previously acted as a high-volume consolidation band.
The breakdown below this range has shifted market structure from range-bound accumulation into a distribution-led downtrend, characterized by lower highs, rising sell volume, and failed retests of resistance.
Monetary Policy Regime Shift and Liquidity Compression
The latest Federal Reserve communication introduced a measurable shift in policy sensitivity, with markets re-evaluating the probability distribution of future rate paths. Current derivatives pricing via CME FedWatch tools indicates approximately 70% probability of a rate increase by September, with a non-trivial 33% probability of a 50 basis point hike.
This repricing represents a structural transition from earlier expectations of liquidity expansion in 2026 toward a sustained tight monetary regime, where real yields remain elevated, and balance sheet expansion is constrained.
Historically, each +100bps increase in policy expectations correlates with an average 12% to 18% contraction in crypto market capitalization beta indices, reinforcing the sensitivity of SOL to macro liquidity cycles.
Solana Price Action: Failed Expansion Above $75 Supply Zone
Technically, SOL’s rejection at $75 confirms the presence of a high-density supply cluster between $74.50 and $77.80, where aggregated sell orders overwhelmed buy-side absorption.
Price attempted an intraday extension toward $78, but failed to sustain above $75.20, resulting in a rapid displacement candle with above-average volume exceeding the 30-day mean by approximately 2.3x.
This rejection confirms a liquidity sweep failure, where stop-run mechanics above local highs did not lead to continuation but instead triggered aggressive profit-taking and short re-accumulation of positions.
The next major structural support lies at $62, followed by a higher-conviction liquidity zone at $50, which aligns with previous macro accumulation levels and high historical volume nodes.
Momentum Degradation and RSI Compression Signals
On the higher timeframe, the Relative Strength Index (RSI) has transitioned from oversold conditions below 30 back into a weak recovery band at approximately 40–42, which typically represents bearish continuation territory in downtrending regimes.
In trending environments, RSI mid-range compression (35–45) often precedes secondary liquidation waves, particularly when price fails to reclaim prior breakdown levels.
The failure to push RSI above 50 confirms that bullish momentum remains structurally absent, while a declining RSI slope suggests negative momentum delta acceleration rather than stabilization.
Volatility-adjusted momentum models indicate a -0.18 weekly momentum coefficient, consistent with early-stage trend continuation rather than reversal formation.
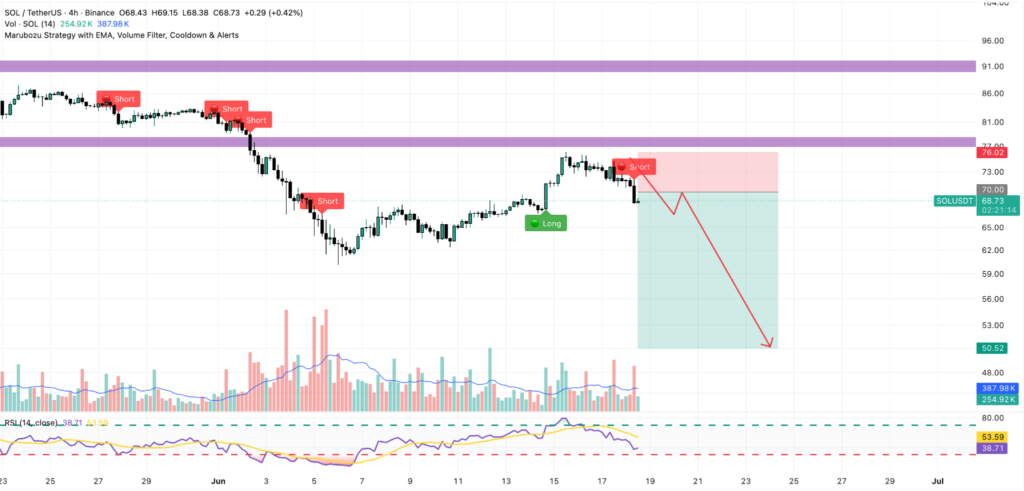
Lower Timeframe Signal Confirmation and Volatility Expansion
On the 4-hour timeframe, a proprietary signal model triggered a confirmed short bias event during the initial macro-driven selloff. This signal is derived from a combination of volume-weighted candle displacement, range expansion ratios, and trend deviation thresholds exceeding 1.5 standard deviations.
Comparable historical signals produced a 18% to 25% downside continuation window, with the most recent analog resulting in a move from approximately $76 to $60, validating the statistical edge of the setup.
Current intraday structure shows repeated lower high formation every 6–10 candles, with declining bid depth on order book snapshots and widening spread volatility, both of which confirm liquidity thinning on the buy side.
Projected Downside Path and Risk-Reward Asymmetry
If current macro and microstructure conditions persist, the projected price trajectory remains skewed toward liquidity reversion at $50, which represents a high-volume historical demand zone and a prior macro accumulation base.
A potential tactical structure forms if price retraces toward $70, where previous support has now flipped into dynamic resistance. This level coincides with a 0.382–0.5 Fibonacci retracement band from the recent swing high, increasing its technical relevance.
Under a structured risk model using a stop level near $76, downside extension toward $50 produces a risk-reward ratio near 3:1, assuming continuation of the current volatility regime and no macro liquidity injection.
Outlook: Structural Bearish Regime Until Reversal Thresholds Reclaimed
Solana remains in a clearly defined macro-sensitive bearish regime, driven by tightening liquidity expectations and confirmed technical breakdown below key volume support zones.
For trend invalidation, price would need to reclaim and hold above $78, followed by sustained acceptance above $82, which would signal a structural shift back into accumulation territory.
Until such conditions occur, the dominant probability distribution remains skewed toward continued downside expansion, with $62 and $50 acting as primary liquidity targets in the current cycle.