
The Light Sweet Crude Oil (WTI) market is currently trading at a highly sensitive technical junction, pressing directly into the 200-day Exponential Moving Average (EMA). This level, sitting near the $80.20–$80.60 zone, is widely regarded as a defining marker of the long-term trend direction, separating broader bullish expansion regimes from potential bearish structural reversals. In this article, Marbrisse brokers break down the subject in a detailed and accessible way.
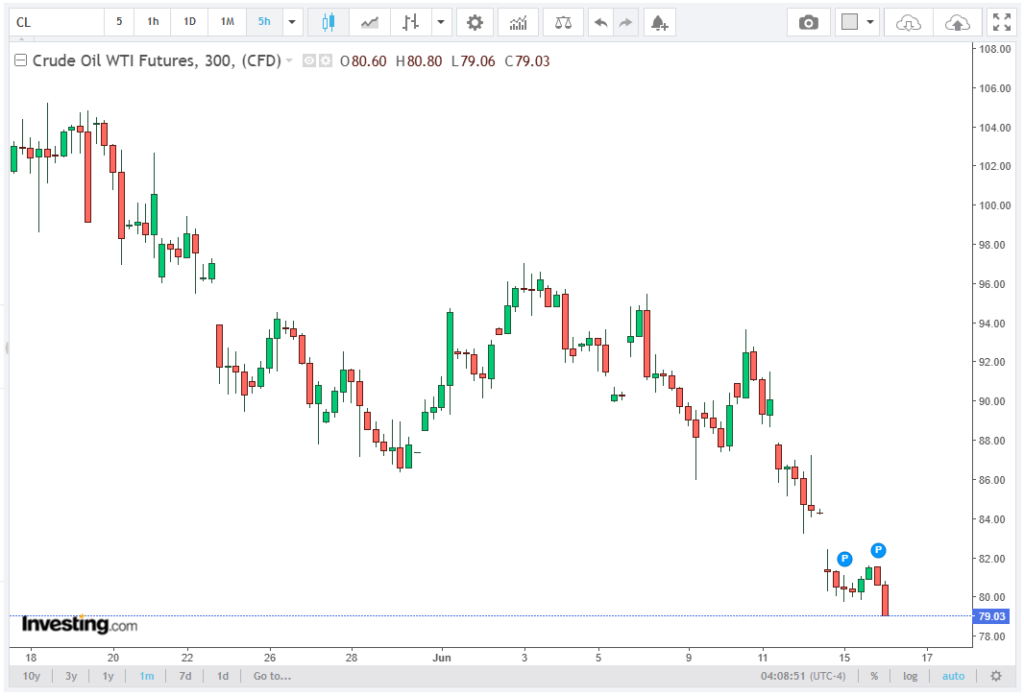
The market opened the week with a downside gap of roughly 1.5%–2.0%, immediately shifting short-term momentum into a corrective phase. Price action is now compressed between $79.50 and $81.20, effectively locking WTI into a tight equilibrium range directly around the 200-day EMA.
This type of compression around a major moving average typically signals an imminent volatility expansion, as liquidity builds on both sides of the market.
The 200-Day EMA as a Structural Pivot
The 200-day EMA functions as a critical institutional reference point for identifying whether crude oil is in a sustained bull trend or transitioning into distribution. In the current structure, repeated tests of the $80.00 psychological level reinforce its importance as a macro pivot zone, with the EMA acting as a dynamic anchor.
A sustained breakdown below both the 200-day EMA (~$80.30) and the horizontal support at $80.00 would represent a significant shift in medium-term structure. Such a move would signal that buyers have failed to defend the long-term trend line, increasing the probability of a deeper bearish extension phase.
Volume behavior over recent sessions shows a concentration of traded liquidity between $79.00 and $81.50, meaning the market is currently trading within a high-density zone. A break below this region would likely trigger a fast move due to limited historical liquidity beneath it.
Bearish Breakdown Scenario Toward $71.00
The dominant technical setup forming is a potential bearish continuation signal triggered by a confirmed daily close below the 200-day EMA. This confirmation is crucial, as intraday breaks alone are insufficient in volatile commodity markets like crude oil.
If price closes below this level with expanding downside momentum and daily range extending beyond $2.50, the market opens a structured path toward lower support zones. The first intermediate target lies near $74.50, which represents a prior consolidation base where buyers previously re-entered the market.
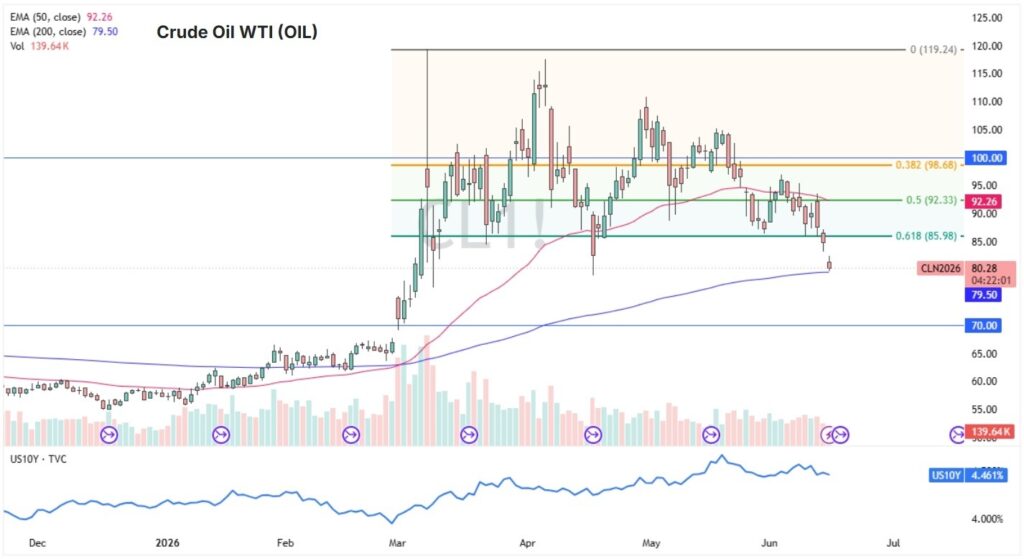
Beyond that, the primary downside objective is located at $71.00, a major structural support level derived from previous swing lows and broader accumulation zones. This represents a total potential downside extension of approximately 8%–11%, consistent with historical breakdowns following failed retests of the 200-day EMA in crude oil cycles.
Momentum confirmation would likely come from weakening short-term indicators, particularly a sustained decline in RSI below 45 and a bearish crossover in MACD structure, reinforcing the continuation of downside pressure.
Bullish Rejection Scenario Toward $85.00
If the 200-day EMA continues to hold as support, the market may instead form a bullish rejection structure, resulting in a rebound phase. In this case, stabilization above $80.00, followed by recovery above $81.80, would signal that selling pressure is being absorbed.
The first technical resistance lies at $83.50, a minor breakdown zone where prior selling acceleration occurred. Above this, the key resistance level is located at $85.00, which aligns with the upper boundary of the recent gap and a previous distribution region.
This $85.00 zone represents a high-probability area for rejection due to concentrated liquidity and potential profit-taking from short-term participants. Without a clean breakout above $85.50, upside movement is likely to remain corrective rather than trend-reversing.
Volatility Compression and Expansion Risk
The current price structure reflects a clear phase of volatility compression, with narrowing daily ranges and repeated tests of the $80.00 pivot zone. Historically, such compression phases in crude oil resolve with directional expansions of 5%–10% within a short timeframe, typically between five and ten trading sessions.
The direction of this expansion will depend entirely on whether the market accepts or rejects the 200-day EMA. Acceptance below it increases the probability of a structured move toward $71.00, while rejection and stabilization above it would shift momentum back toward $85.00–$87.00 resistance territory.
Conclusion: Critical Technical Decision Zone in WTI
WTI crude oil is currently positioned at a decisive structural inflection point where the 200-day EMA near $80.30 acts as the central battleground between buyers and sellers. The market is effectively coiled around this level, with compressed volatility suggesting an imminent directional breakout.
A confirmed daily close below the 200-day EMA activates a high-probability bearish continuation structure, targeting $71.00, with risk controlled by a $2 stop above the EMA zone. Conversely, sustained defense of this level would invalidate downside momentum and reopen the path toward $85.00 resistance.